RESEARCH
CMU Miami and the Wynwood Corridor: Underwriting a Campus Catalyst
This report turns our quantitative work on Carnegie Mellon University's planned Miami campus into positioning guidance for developers, owners, lenders and land holders active in Miami's urban core. It deliberately leaves out the model mechanics. The complete research package, including the full model and methodology appendix, is available here. All rent and demand effects discussed here are incremental: they measure the difference between a Miami with CMU and the same Miami without it, not total expected rent growth.1 This is research, not investment advice.
1. Executive Overview
On September 30, 2026, Carnegie Mellon University and Ken Griffin announced CMU Miami, a 35-acre campus in Wynwood funded by $2 billion of a $3 billion gift. By any measure it is an unusually large institutional commitment to a single urban neighborhood, and early coverage has framed it in the language of established innovation districts such as Kendall Square. Investors should expect land owners and marketers near the site to price in that narrative quickly.
Our central conclusion is more measured. CMU Miami is a real, durable and positive demand catalyst, but it is modest relative to the size of the Miami market, slow to arrive and highly localized. The campus reaches its full announced scale of more than 3,500 students, nearly 300 faculty and more than 600 staff only in the mid-to-late 2030s. Even then, the incremental rental housing demand it generates across the metro, a little over 1,400 renter households by 2036 in our central case, is less than a fifth of what the Miami market absorbed in a single recent year. The effect is meaningful only within about two miles of the site, and physically immaterial anywhere before roughly 2030 to 2031.2
Within that envelope, the opportunity is not where the headlines point. Three findings matter most for regional capital.
First, the most durable rent benefit accrues to older, workforce-oriented housing next to the site, not to new Class A product. Wynwood's Class B/C apartments and its small stock of single-family and two-to-four-unit rentals show the steadiest gains, rising to roughly 1.5% above the no-CMU path by 2033 and about 2.6% to 2.7% by 2035. The reason is structural: nobody builds new Class B/C, so the incremental demand from graduate students, postdocs, staff and early-career researchers is never fully met by new supply. That same mechanism is where displacement pressure on existing residents will show up, which carries policy risk.
Second, Wynwood Class A gets an early, expectations-driven bump that is likely to fade. Asking rents near the site can plausibly run about 1% ahead of the no-CMU path through 2028 on sentiment alone, but the developer supply response, including private projects that cite CMU as their rationale, can overtake physical demand by the mid-2030s. By 2035 our central case shows Wynwood Class A essentially flat to slightly negative versus the counterfactual. Investors who pay today for a CMU premium on new Class A are paying for something the market will likely compete away.
Third, the commercial story is mixed, and demand starts negative for retail and hospitality. The campus displaces Mana Wynwood's festival and convention business, and that lost foot traffic outweighs campus spending on Wynwood retail and hotels until roughly 2035 to 2036. Office benefits modestly and early if CMU leases interim space while it builds. Laboratory and R&D demand shows large percentage gains, but only because Wynwood's existing lab inventory is tiny. That is a signal for build-to-suit and conversion development, not rent growth on existing buildings.
For underwriting, the practical implication is simple. Underwrite every asset in the corridor on its no-CMU fundamentals through 2030, and add only small, phase-specific premiums thereafter: about 40 basis points per year above baseline for Wynwood workforce housing from 2032, 20 to 30 basis points for Midtown, and none for Wynwood Class A or office. Wynwood retail and hotels warrant a negative adjustment for the event-displacement period. Being early in the corridor is valuable for the option it buys on enrollment and partner announcements, not for near-term income.
2. The Announcement in Context
What has been officially confirmed
The official record, meaning CMU's own announcement materials and the CMU Miami website, is narrower than much of the coverage. CMU has confirmed a gift from Ken Griffin of $3 billion, of which $2 billion supports the launch of CMU Miami and $1 billion supports the Pittsburgh campus. It has confirmed a campus of 35 acres in Wynwood and a target scale at full build-out of more than 3,500 undergraduate, master's and doctoral students, nearly 300 faculty and more than 600 staff. The academic program is organized around four grand challenges (health and biological discovery, national security, energy and climate resilience, and advanced manufacturing), with computing running through all of them. Construction is slated to begin in 2027, with the first students, graduate students first, arriving in 2028. CMU itself frames all of this as subject to regulatory approvals.3
What is reported but not confirmed
Several facts that are already circulating as settled come from the press and the seller rather than from CMU or Griffin. Media reports describe Griffin's purchase of roughly 30 acres of the Mana Wynwood assemblage, including the convention center, Wynwood Marketplace and the RC Cola Plant, for about $1.1 billion in cash, and cite an address of 318 NW 23rd Street. That address does not appear in the official releases we reviewed. Mana's own release dates the closing to September 29, while The Real Deal reports that the majority of the deal closed in June. Earlier reports of a deal at more than $700 million were rumors that both parties denied in January 2026. The gap between a reported 30-acre purchase and a 35-acre campus has not been publicly reconciled. Mana is clearly still active nearby: its release says it retains more than 15 acres in the Wynwood area.
No on-campus housing bed count has been announced. As Sections 8 and 9 explain, that single number matters more to the residential outlook than any other piece of information still outstanding.
| Item | Status | Basis |
|---|---|---|
| Funding | $2B of a $3B Griffin gift for CMU Miami; $1B for Pittsburgh | Official (CMU) |
| Site | 35-acre campus in Wynwood, subject to regulatory approvals | Official (CMU) |
| Scale at build-out | 3,500+ students; nearly 300 faculty; 600+ staff | Official (CMU) |
| Program | Four grand challenges; industry research labs and venture studios | Official (CMU) |
| Timeline | Construction start 2027; first (graduate) students 2028 | Official, pending approvals |
| Land purchase | ~30 acres for ~$1.1B cash; closed Sept 29 (Mana), majority in June (The Real Deal); 318 NW 23rd St | Seller release; press |
| Earlier rumor | $700M+ deal; denied by both parties (January 2026) | Press |
| Mana retained land | More than 15 acres retained in the Wynwood area | Seller release |
| On-campus housing | No bed count announced | Key unknown |
| Event uses | Existing operators to continue events for at least a year | Press (The Real Deal) |
Sources: CMU president's letter, CMU Miami website and CMU News (official); Mana's release (seller); The Real Deal, Bisnow, CommercialSearch (press). Detail and full source list in the companion investment committee memo.
Why the headlines overstate the near-term effect
The comparisons most often invoked, Kendall Square, Cornell Tech and Columbia's Manhattanville expansion, are instructive mostly for their differences. Each sits in a supply-constrained market where new construction is slow and expensive to entitle, so incremental demand shows up in price. Miami is much less constrained: its urban core has been able to add supply quickly, with a multifamily pipeline that recent industry reports place between roughly 15,000 and 19,000 units, roughly 7% to 10% of existing inventory. Developers in Wynwood, Edgewater and Allapattah can and will respond to CMU within a few years, which caps the rent effect for any product type that can be newly built.
Scale matters as well. Kendall Square's transformation came from decades of compounding at MIT, the Broad Institute and an established biotech ecosystem with millions of square feet of lab space. CMU Miami at full build-out is roughly the size of a large professional school. It will be important for Miami's innovation economy, but its direct real estate footprint is measured in hundreds of households and tens of thousands of square feet per year, not in millions.
Finally, timing. The physical arrival of people is back-loaded: a planned graduate-first opening in 2028, undergraduates later, and a ramp that, if it follows the pattern of comparable new campuses, takes most of a decade. The near-term move in asking rents is therefore almost entirely about expectations, and expectations can reverse.
3. Sizing the Demand
The population ramp
Our central case assumes CMU opens on schedule in 2028 and takes about ten years to reach full enrollment, a deliberately conservative pace relative to CMU's ambitions but consistent with how comparable new campuses have grown. Under that ramp, enrollment reaches roughly 100 students in 2028, about 530 by 2030, about 870 by 2031, about 1,650 by 2033 and about 3,000 by 2036. Faculty and staff ramp somewhat ahead of students. By 2036, direct campus-related employment (faculty, staff, postdoctoral researchers, industry partner employees and startup employees) reaches about 1,800, with roughly 1,100 further jobs induced in the wider economy.4
Not all of these people become new renters in the surrounding market. A large share of undergraduates will live on campus, many graduate students will share apartments, some faculty and staff will already live in Miami, and most induced jobs will be filled by existing residents rather than new arrivals. Our central case treats only a quarter of induced jobs as new households. It also assumes three-quarters of undergraduates and nearly a third of graduate students live on campus, given that no bed count has yet been announced.5
How big is it relative to the market?
Converting that population into real estate demand yields the figures in Exhibit 2. Across the metro, the campus generates roughly 330 additional renter households by 2030, about 800 by 2033 and a little over 1,400 by 2036. About 40% to 45% of that demand is for Class A product and about 35% for Class B/C, with the remainder in single-family, small multifamily and furnished rentals. Off-campus student-housing demand is small, about 160 beds in 2033.
For perspective, the Miami market absorbed about 7,600 multifamily units in the twelve months to mid-2026, against roughly 7,800 completions. Over ten years, CMU adds less than one-fifth of a single year's absorption. That is not trivial when concentrated in a few square miles, but it is an order of magnitude smaller than the swings in supply and macro demand that will drive Miami rents over the same period. CMU will shape relative performance within the corridor more than it shapes absolute rent levels.
| Demand | 2028 | 2030 | 2033 | 2036 |
|---|---|---|---|---|
| Renter households (all types) | 135 (0 to 190) | 332 (175 to 493) | 796 (526 to 1,175) | 1,423 (1,000 to 1,980) |
| of which Class A | 25 | 114 | 341 | 621 |
| of which Class B/C | 57 | 126 | 282 | 501 |
| Off-campus student beds | 8 | 45 | 159 (94 to 254) | 305 (196 to 459) |
| Office sf (incl. interim) | 61,900 | 72,200 | 41,200 (20,200 to 77,900) | 78,000 (39,500 to 144,700) |
| Lab sf | <1,000 | 5,500 | 23,100 (10,100 to 49,000) | 46,400 (21,300 to 93,300) |
| Flex / light industrial sf | <1,000 | 3,500 | 14,200 | 28,400 |
| Retail sf, net of event loss | -24,500 | -21,100 | -11,100 | +1,100 |
| Hotel rooms (net occupied) | -41 | -35 | -19 | +1 |
Source: CMU Miami Rental Impact Model, central case and simulated range. Metro-level demand before allocation to submarkets. Full tables in the companion investment committee memo, Section 4.
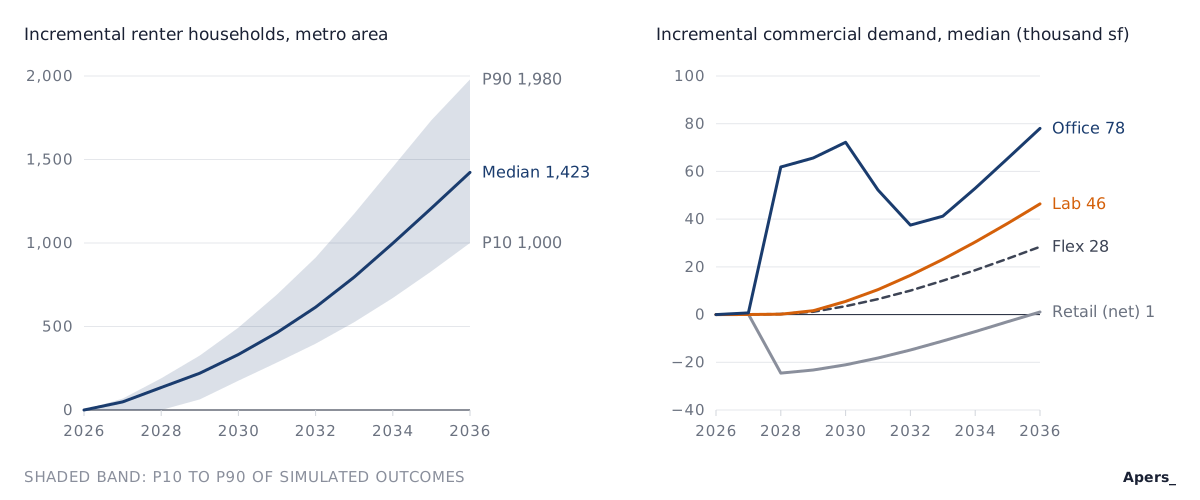
Shaded band shows the likely range; line shows the central estimate.6Source: CMU Miami Rental Impact Model.
Commercial demand and the event offset
Commercial demand follows a different path. Office demand appears first, around 2028, if CMU leases interim academic and administrative space in the corridor while the permanent campus is built. We assume about 60,000 square feet. As the permanent campus opens and those functions move on site, incremental office demand dips in the early 2030s before rebuilding with industry partners and startups. Laboratory and flex demand builds steadily from about 2030, reaching roughly 23,000 and 14,000 square feet respectively by 2033 and approximately double that by 2036. These are modest absolute quantities: a single mid-sized lab building would exceed the central estimate for lab demand through the mid-2030s.
Retail and hospitality start in a hole. Mana Wynwood has been one of Miami's principal venues for festivals, conventions and Miami Music Week events, and its visitors spend money in Wynwood restaurants, bars, shops and hotels. Our central case removes that traffic from 2028, after the operators' stated one-year continuation window. The lost visitor spending is equivalent to roughly 20,000 to 25,000 square feet of retail demand, and new spending by students and employees does not fully replace it until about 2036. Hotel demand follows the same arc: a net loss of about 40 occupied rooms per night at the start, recovering to neutral only at the end of the horizon. Over a ten-year hold, this offset is the single most overlooked feature of the CMU story.
4. Where the Effect Lands
Geography: a steep gradient
Demand does not spread evenly across Miami. Students, researchers and staff choose housing based on distance and travel time to campus, transit access, affordability relative to their incomes, and available supply. We allocate demand using a gravity approach that weights each submarket by these factors.7 The result is a sharply declining gradient. Wynwood captures the largest share of incremental residential demand, followed by Midtown, Edgewater and Allapattah. Downtown and Brickell receive small shares, mostly from higher-income faculty and partner employees. By 2033, the central-case Class A rent effect is about 0.7% in Midtown, 0.4% in Edgewater, 0.2% in Downtown and 0.1% in Brickell. The Little Havana / Coral Way control area, chosen as a comparable Miami submarket with low expected CMU exposure, shows about 0.2%.
A notable feature of the results is that Midtown Class A outperforms Wynwood Class A from the early 2030s onward. That is not because Midtown is a better location for CMU demand. Wynwood bears both the bulk of the near-term delivery wave and the bulk of CMU-related speculative development, which absorbs its demand advantage. Midtown, with less developable land, keeps more of the spillover as rent.
Property type: who benefits and who does not
Workforce multifamily and small rentals (Wynwood, Midtown). These are the clearest beneficiaries. Graduate students, postdoctoral researchers and junior staff have incomes that steer them toward older, lower-rent stock, and that stock is not replenished by new construction. In Wynwood, Class B/C asking rents run about 0.7% above the no-CMU path in 2030, about 1.4% by 2033 and about 2.6% by 2035, with vacancy roughly one point tighter. Single-family and two-to-four-unit rentals in Wynwood show a similar path. Midtown B/C follows at about two-thirds the magnitude. The caveat is that these are small inventories in a neighborhood where displacement is already politically sensitive. Effects of this kind attract tenant-protection and affordability responses.
Class A multifamily (Wynwood, Allapattah). Class A near the site shows the classic catalyst arc: an early expectations premium of about 1.2% in 2028, eroding to about 0.5% by 2033 and turning flat to negative by 2035 as new supply catches up with demand. Concessions tell the same story more sharply. Effective rents, which account for free rent, are already slightly below the no-CMU path by 2033 because added supply re-widens concessions. Allapattah Class A is more exposed still: it has the most developable land within easy reach of campus, and our central case shows it about 1.3% below the counterfactual by 2035 if CMU-related projects proceed there as expected.
Office and coworking. Wynwood office benefits by about 1% from 2028 through the early 2030s, supported largely by interim CMU leasing, then fades as the campus opens and CMU-related office supply arrives. Midtown and Allapattah office see smaller but steadier gains. Office is a timing trade, not a structural thesis.
Laboratory and R&D. Wynwood's estimated existing lab stock of roughly 50,000 square feet is so small that any real demand produces large percentage changes, about 8.5% above baseline by 2033 in our central case, with a very wide range. Allapattah and the Overtown Health District show more moderate gains of about 1.7% and 0.7%. Investors should read these as evidence that conversion and build-to-suit lab development near the campus will find tenants, not as a forecast of rent growth on a few existing buildings.
Retail, food and beverage, and hotels (Wynwood and adjacent). These are the most negatively affected segments over the medium term. Wynwood retail rents run about 0.8% below the counterfactual by 2033 and 1.3% below by 2035. Wynwood hotel average daily rate falls about 2.5% below by 2033 and further thereafter, because event demand disappears just as modest new hotel supply arrives nearby. Midtown, Allapattah, Design District and Edgewater hotels show smaller negative effects. Furnished short- and mid-term rentals are the exception in the hospitality space: visiting researchers, interns and families support them modestly, although City of Miami short-term rental rules, which we have not reviewed for this report, could constrain that segment.
| Segment | 2028 | 2030 | 2033 | 2035 | Read-through |
|---|---|---|---|---|---|
| Wynwood Class B/C | +0.6% | +0.7% | +1.4% | +2.6% | Most durable; displacement risk |
| Wynwood SFR / 2-4 unit | +0.6% | +0.7% | +1.5% | +2.7% | Small stock; durable |
| Midtown Class B/C | +0.4% | +0.4% | +1.0% | +1.8% | Spillover; steady |
| Midtown Class A | +0.6% | +0.4% | +0.7% | +1.4% | Best Class A exposure |
| Edgewater Class A | +0.4% | +0.3% | +0.4% | +0.8% | Modest |
| Wynwood Class A | +1.2% | +0.7% | +0.5% | -0.2% | Expectations bump fades |
| Allapattah Class A | +0.5% | +0.4% | +0.4% | -1.3% | Supply risk |
| Allapattah / Overtown B/C | +0.2% | +0.2% | +0.4% | +0.8% | Small, positive |
| Wynwood office | +1.2% | +1.1% | +1.0% | +0.4% | Interim-lease timing trade |
| Allapattah lab | +0.5% | +0.4% | +1.7% | +3.9% | Conversion signal |
| Wynwood retail | +1.7% | +0.5% | -0.8% | -1.3% | Event loss outweighs campus |
| Wynwood hotel (ADR) | +0.6% | -0.6% | -2.5% | -6.5% | Most negative |
| Downtown / Brickell Class A | +0.1% to +0.2% | 0.0% to +0.1% | +0.1% to +0.2% | +0.1% to +0.4% | Negligible |
| Control area Class A | 0.0% | 0.0% | +0.2% | +0.4% | Background drift |
Source: CMU Miami Rental Impact Model. Likely ranges for every cell are in the companion investment committee memo, Sections 5 and 6.
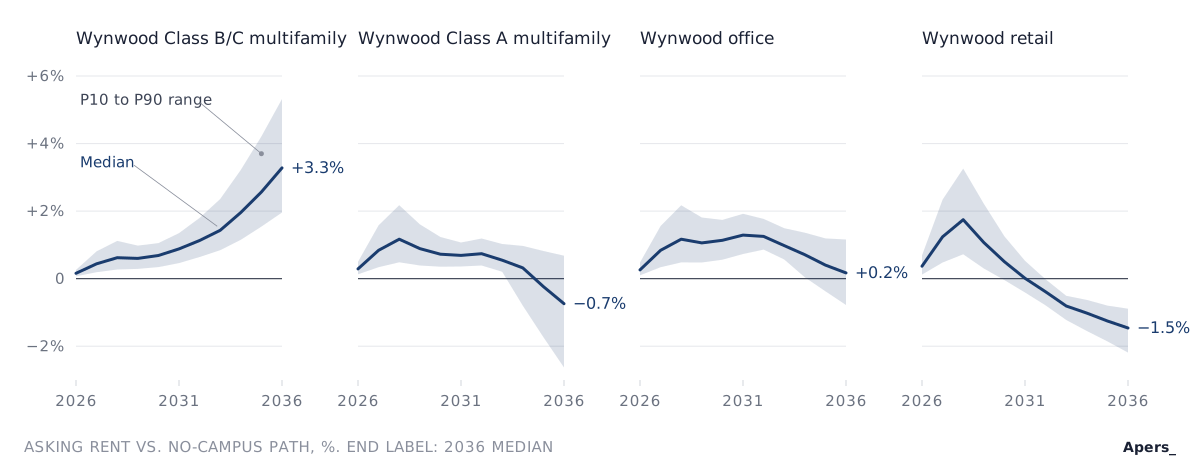
Shaded band shows the likely range; line shows the central estimate.6Source: CMU Miami Rental Impact Model.
The full analysis is available here.
Open the research package5. Timing: Four Phases
The CMU effect unfolds in four distinct phases, and each calls for a different underwriting posture. The most common error we expect to see in the corridor over the next two years is treating phase-one sentiment as phase-three fundamentals.
Phase 1: Announcement (late 2026 to 2027). Nothing physical has changed, but expectations have. Asking rents near the site may firm by up to about 1%, land asking prices will move much more, and brokers will market proximity to campus. At the same time, the baseline is soft: Wynwood Class A is absorbing a delivery wave that pushes vacancy materially higher in 2027 in our baseline, and several buildings are already offering two to three months of free rent. The expectations premium therefore shows up mostly in asking rents and land, not in effective rents or net operating income. Nothing in this phase should be capitalized into a valuation.
Phase 2: Construction and opening (2027 to 2028). The construction start brings a temporary construction workforce, interim CMU leasing and the first graduate cohort. This is the window for tactical wins in office leasing and furnished rentals. It is also when Mana's event business is expected to wind down, so Wynwood retail and hotels begin to feel the offset. Regulatory approvals are the critical path: any slip in the 2027 construction start pushes every later phase back one-for-one.
Phase 3: Ramp-up (2029 to about 2034). Enrollment and employment grow from several hundred to a few thousand. Physical demand becomes material for the first time around 2030 to 2031, starting with workforce housing in Wynwood and Midtown. This is also when the private supply response arrives, so Class A near the site moves from an expectations premium to a supply contest. Lab and flex demand becomes visible, and the first spinouts and industry partners seek space.
Phase 4: Stabilization (about 2035 onward). The campus approaches full scale. Workforce housing near the site holds its premium; Class A converges back toward the no-CMU path or below it where supply was overbuilt; retail and hotels recover toward neutral as campus spending replaces lost event traffic. The innovation-district upside, a genuine lab cluster, is either visibly forming by this point or it is not.
| Phase | Years | What moves | Underwriting posture |
|---|---|---|---|
| Announcement | Q4 2026 to 2027 | Asking rents near site (~+1%), land prices, sentiment; baseline Class A vacancy rising on deliveries | Underwrite baseline only; treat asking-rent firmness as non-recurring |
| Construction / opening | 2027 to 2028 | Interim office leases, construction workforce, first graduate cohort; event business winds down | Tactical office and furnished-rental upside; begin retail/hotel haircut |
| Ramp-up | 2029 to ~2034 | Workforce housing tightens; private supply response; lab and flex demand emerges | Small premiums for B/C from ~2030; supply risk on new Class A |
| Stabilization | ~2035 onward | B/C premium holds; Class A converges; retail/hotel recover | Steady-state premiums for workforce housing only |
6. Underwriting Implications
Start from the counterfactual
The single most important discipline for any corridor underwriting is to build the no-CMU case first and defend it on its own merits: current rents and concessions, the probability-weighted delivery pipeline, metro job and household growth, and interest rates. Miami's recent baseline is not strong. Miami effective rents were roughly flat year-on-year in mid-2026, occupancy was about 94.6%, and Class A concessions in Wynwood are elevated. Any CMU premium is a small adjustment on top of that baseline, not a substitute for it.
Recommended rent-growth adjustments
Exhibit 5 sets out our recommended adjustments, expressed as basis points per year added to (or subtracted from) the asset's no-CMU rent growth, by phase. They are rounded down from the model's central case, deliberately, for conservatism. A Wynwood Class B/C owner applying the recommended 40 basis points a year from 2032 would accumulate roughly a 2% cumulative rent advantage by 2036, consistent with the central case but below its upper range.
| Asset / submarket | 2026 to 2028 | 2029 to 2031 | 2032 to 2036 | Comment |
|---|---|---|---|---|
| Wynwood Class B/C | 0 | +5 | +40 | Effective-rent case up to +50 from 2032 |
| Wynwood SFR / 2-4 unit | 0 | +5 | +40 | Small stock; displacement and policy risk |
| Midtown Class B/C | 0 | +5 | +30 | Spillover from Wynwood |
| Midtown Class A | 0 | 0 | +20 | Best Class A exposure |
| Edgewater Class A | 0 | 0 | +10 | |
| Allapattah / Overtown Class B/C | 0 | 0 | +10 | |
| Wynwood Class A | 0 | 0 | 0 | Do not capitalize the 2027-28 asking bump |
| Allapattah Class A | 0 | 0 | -25 | CMU-related supply risk |
| Wynwood furnished / short-term | 0 | 0 | 0 | Regulatory risk unresolved |
| Wynwood and Midtown office | 0 | 0 | 0 | Treat interim CMU leasing as lease-up upside |
| Allapattah lab | Lease-up | Lease-up | +50 with anchor | Underwrite occupancy, not rent, until an anchor lease is signed |
| Wynwood lab | Development | Development | Development | Build-to-suit play; not applicable to existing stock |
| Wynwood retail | 0 | -40 | -25 | Event loss; recovers after ~2035 |
| Wynwood hotel ADR | 0 | -50 | -125 | Unless new demand generators are announced |
| Downtown, Brickell, control areas | 0 | 0 | 0 | Effect negligible |
Source: CMU Miami Rental Impact Model; recommendations rounded down from central-case results. Model results by phase are in the companion investment committee memo, Section 8.
Beyond rent growth: land, exit, concessions and lease-up
The following guidance reflects our judgment informed by the model, not direct model outputs.
Land basis. Land within a mile of the site will trade on expectations during the announcement phase. A useful discipline is to solve for the CMU premium a land price implies: if a residual land value only works with Class A rent growth meaningfully above the no-CMU path from 2028 to 2031, the buyer is paying for the bull case in a product type where we expect the premium to be competed away. Land is easier to justify where the intended use is in a segment with durable exposure (workforce or graduate-oriented housing, lab conversion) or where the basis works without any CMU effect.
Exit capitalization rates. We would not compress exit cap rates for CMU proximity in any asset class. The innovation-district narrative may well support cap rate compression in a bull outcome, but that is precisely the outcome the base case should not assume. If an investment committee wants to reflect it, it belongs in a named upside case.
Concessions and effective rents. For Wynwood Class A, underwrite current concession levels persisting through the 2027 to 2028 delivery wave and re-widening when CMU-related supply arrives in the early 2030s. The gap between asking and effective rents is where the expectations premium will be most visibly unwound.
Lease-up velocity. Assume no CMU-driven improvement in absorption pace before 2030 for residential product. For office, a pre-lease or interim lease with CMU or a named partner is the only reliable trigger for faster lease-up; speculative office should not assume CMU tenancy.
Debt sizing. Lenders and borrowers should size loans on the no-CMU case. The CMU effect, even at the central estimate, is too small and too back-loaded to support leverage in the first five years of a hold.
The full analysis is available here.
Open the research package7. Strategic Positioning
The opportunity set looks quite different depending on where an investor sits. We address each audience in turn.
Ground-up residential developers
The highest-risk play in the corridor is speculative Class A multifamily within a mile of the site, timed to deliver between 2029 and 2032. That is exactly when the private supply response peaks and before physical demand is mature, and our results show the CMU benefit to Wynwood and Allapattah Class A being competed away in that window. Developers with land near the site should consider product differentiation instead: smaller, more affordable units suited to graduate students, postdocs and staff; furnished mid-term units for visiting researchers; or purpose-built graduate and faculty housing, ideally structured with CMU or delivered in partnership once the university's own housing plan is known. Until a bed count is published, any purpose-built student or graduate project carries the risk that CMU houses more students on campus than expected.
Value-add and workforce-housing investors
The best risk-adjusted exposure is existing Class B/C multifamily and small rental stock in Wynwood, Midtown and, to a lesser degree, Allapattah and Overtown, acquired at prices that work on baseline fundamentals. This position benefits from the most durable component of the CMU effect at no premium to entry, and it does not depend on enrollment hitting its targets quickly. A seven-to-ten-year hold captures the ramp-up and stabilization phases. Investors should be realistic about the policy environment: rising rents in older stock near a well-funded institution invite tenant-protection measures, community-benefit demands and reputational scrutiny. Community engagement, moderate renovation scope and attention to existing tenants are part of protecting the thesis, not a cost to it.
Core and core-plus holders
Owners of stabilized Class A in Brickell, Downtown and Edgewater have little reason to reprice their assets in either direction. The CMU effect in those submarkets is a rounding error relative to baseline drivers. Midtown Class A is the one core-type exposure with a measurable long-run benefit, and even there the recommended premium is only about 20 basis points a year from 2032. Holders of Wynwood Class A should recognize that the announcement window may represent the high-water mark of CMU-related sentiment for their buildings; it is a reasonable moment to test the market.
Commercial developers and owners: office, lab and flex
For office owners in Wynwood and Midtown, the tactical opportunity is interim space. CMU and its early partners will need academic, administrative and incubator space between 2027 and the campus opening, and owners with flexible, move-in-ready floor plates are well placed to capture it. That demand is temporary, so it should be priced as lease-up upside rather than a permanent rent step. For lab, the more promising locations are Allapattah's industrial stock and the Overtown Health District, where conversion is feasible and adjacency to the University of Miami and Jackson medical campuses adds a second demand driver. Lab development should be pursued on an anchor-led basis; speculative lab without a named tenant remains high risk in a market without an established life-science cluster.
Retail and hospitality owners in Wynwood
Owners of Wynwood retail and hotels face a medium-term headwind that is easy to miss amid the positive coverage. Festival and convention visitors who once filled the neighborhood on peak weekends will largely disappear from 2028, and campus-driven daily demand takes until the mid-2030s to replace them. Retail owners should begin shifting tenant mix toward everyday and weekday needs (food, convenience, services and fitness) that serve students, researchers and residents. Hotel owners should look to extended-stay and corporate demand from visiting researchers, faculty recruits, families and partner companies, and should expect weaker peak-weekend pricing. Assets that rely on event compression should be underwritten with a decline in average daily rate through the early 2030s.
Land holders, sellers and lenders
For owners of land near the site who are not natural long-term developers, the announcement period is likely to be one of the most favorable windows to sell, because buyer expectations currently exceed what the physical demand will support for most product types. For lenders, the guidance is symmetrical: size on baseline fundamentals, be cautious about construction loans for speculative Class A and lab near the site timed for 2029 to 2032, and treat CMU proximity as a credit positive mainly for older workforce housing.
| Audience | Preferred play | Avoid | Timing |
|---|---|---|---|
| Ground-up residential | Graduate/faculty housing, smaller units, furnished mid-term | Speculative Class A delivering 2029-32 within 1 mile | Await CMU housing plan |
| Value-add / workforce | B/C and SFR / 2-4 unit in Wynwood, Midtown, Allapattah, Overtown at baseline pricing | Paying a CMU premium at entry | Acquire 2026-28; hold 7-10 yrs |
| Core / core-plus | Hold Brickell, Downtown, Edgewater; Midtown Class A modestly favored | Repricing on CMU news | No action required |
| Office owners | Flexible interim space for CMU and early partners | Treating interim demand as permanent | 2027-28 leasing window |
| Lab / flex developers | Anchor-led conversion in Allapattah and Health District | Speculative lab | Pursue once partners are named |
| Retail / hotel owners | Reposition to weekday, everyday and extended-stay demand | Underwriting event-driven peaks | Begin before 2028 |
| Land holders / lenders | Sell into announcement window; lend on baseline | Leverage on CMU premium | Now through 2027 |
8. Risks and the Counter-Thesis
What would have to be true for the bull case
A materially stronger outcome, with Wynwood Class B/C rents about 6% above baseline and Class A about 3.5% above by 2033, is possible, but it requires several favorable developments at once. Enrollment would need to reach full scale within about seven years of opening. CMU would need to house far fewer students on campus than we assume, roughly 40% of undergraduates and 10% of graduate students. Industry partners would need to bring 2,500 or more employees to the area by the mid-2030s, with most of their laboratories located off campus. The wider economy would need to respond strongly, and the competing development pipeline and CMU-related speculative supply would both need to come in below expectations. Each of these is individually plausible. All of them together are unlikely, which is why this combined scenario sits well above the range our simulation considers likely.8
What would have to be true for the bear case
The bear case is easier to construct. A two-year delay in approvals or opening, CMU housing most undergraduates and half of graduate students on campus, a thin roster of industry partners (a few hundred jobs rather than thousands), and both the general pipeline and CMU-inspired projects delivering more supply than expected would together leave Wynwood Class A about 1% below the no-CMU path by 2036, with Wynwood Class B/C only marginally positive at about 0.7%. Notably, even the bear case does not turn workforce housing negative, which reinforces our view that this is the most robust exposure.
| Driver | Bull | Central | Bear |
|---|---|---|---|
| Approval / opening | On time (2028) | On time (2028) | Two-year delay |
| Ramp to full enrollment | ~7 years | ~10 years | Slower |
| On-campus housing (UG / grad) | 40% / 10% | 75% / 30% | 90% / 50% |
| Industry partner employees | 2,500+ | Moderate | ~300 |
| Competing pipeline | 80% of expected | As expected | 130% of expected |
| CMU-related private supply | Low | Moderate | 1.5x central |
| Wynwood B/C rent effect | ~+6% by 2033 | ~+1.4% by 2033 | ~+0.7% by 2036 |
| Wynwood Class A rent effect | ~+3.5% by 2033 | ~+0.5% by 2033 | ~-1.1% by 2036 |
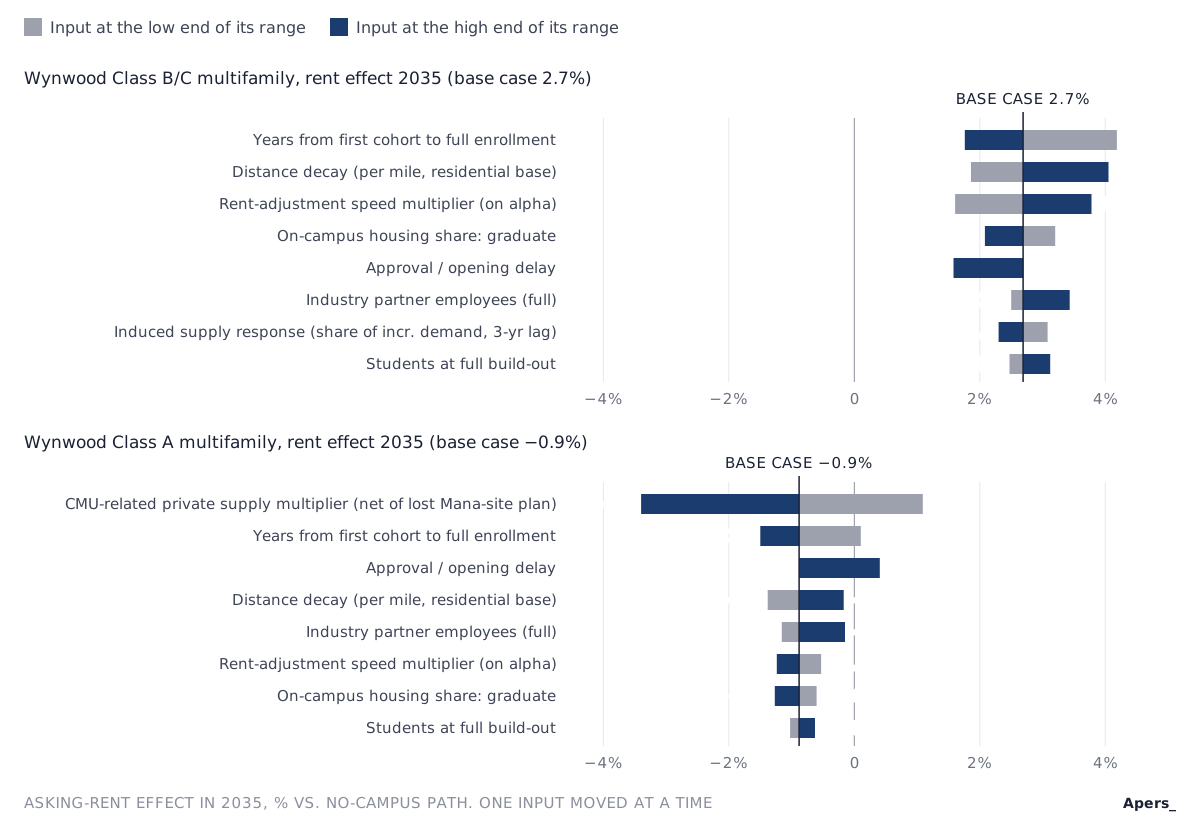
Each bar shows the change in the 2035 rent effect when one input moves from the low to the high end of its range, holding others at central values.9Source: CMU Miami Rental Impact Model.
The case that the effect is smaller, slower or more local
We think investors should give real weight to the possibility that CMU's effect on rents is even more muted than our central case. Four observations support that view. First, by 2035 the odds that Wynwood Class A sees any CMU benefit at all are about 41%, and they decline further by 2036.10 Second, beyond two miles from the site, virtually every segment shows an effect of half a percent or less by 2033, inside the margin of error of any rent forecast. Third, nothing physical is material before 2030, so a hold that exits before then is relying entirely on sentiment. Fourth, national evidence on student housing suggests that, in markets where supply responds, enrollment growth is met roughly bed for bed by new construction, with little lasting effect on rents. Miami's supply elasticity places it closer to that pattern than to Cambridge or Manhattan.
Model and data risks
Our estimates rest on assumptions that investors should understand. Submarket inventories, rents, vacancies and pipelines are estimates anchored to metro-level data and current listings, because detailed submarket data from commercial providers was not available for this work. The parameters that translate demand imbalances into rent changes are drawn from published research rather than calibrated to Miami's own history, and they rank among the most influential inputs in Figure 3. The sensitivity of results to how quickly demand decays with distance is also high. We have not modeled the development that the Mana site itself would have delivered without CMU; removing that counterfactual supply would modestly raise the CMU effect. We have not yet run formal back-tests against comparable campuses such as Cornell Tech or Columbia Manhattanville; the design is documented in the companion model.11
Execution, regulatory and macro risks
Beyond the model, several external risks could change the picture: the pace and terms of regulatory approvals for the campus; City of Miami short-term rental regulations, which we have not reviewed; any affordability or tenant-protection response in Wynwood and Allapattah; Florida insurance and operating-cost pressures, which weigh on all Miami assets regardless of CMU; and the interest-rate path, which drives both baseline rent growth and the speed of the supply response. None of these is CMU-specific, but each can easily outweigh the CMU effect in a given year.
9. Signposts: A 24-Month Monitoring Calendar
The uncertainty around CMU's effect will narrow quickly as a handful of facts become known. We recommend that investors with corridor exposure track the following items and revisit their underwriting when each resolves. The windows below are expected timing, not announced dates.
The on-campus housing plan is the most valuable single disclosure for residential investors. A plan that houses fewer than half of graduate students on campus would shift the outlook toward our bull case for Wynwood and Midtown housing; a plan that houses most students would shift it toward the bear case. Approval milestones determine whether the 2027 construction start and 2028 opening hold; a slip beyond late 2027 should be treated as a one-for-one delay in every phase. Named industry partners and lab commitments, particularly any off-campus anchor lab lease, are the trigger for the lab and flex thesis. Interim space leasing by CMU in Wynwood or Midtown above about 100,000 square feet would strengthen the near-term office case. Speculative supply citing CMU, including new permits or land trades within a mile of the site and activity on Mana's retained parcels, is the key downside signal for Class A; more than about 1,000 newly proposed units would warrant a more cautious posture.Rent and concession prints for Wynwood and Allapattah, compared with the control area, will reveal whether the announcement premium is holding or unwinding. The event calendar at the Mana venue after the one-year continuation window will set the timing of the retail and hotel headwind.
| Window | Signpost | What it would change | Trigger to act |
|---|---|---|---|
| Q4 2026 to Q2 2027 | Entitlement filings and agenda items; land trades near site; Mana event calendar | Approval timing; speculative supply; event-loss timing | Filings delayed or contested; >1,000 units proposed nearby |
| 2027 | Regulatory approvals; construction start; CMU housing master plan or bed count | Opening date; on-campus housing share | Slip beyond Q4 2027; grad on-campus share below 50% |
| 2027 to 2028 | Interim CMU and partner leases; first named industry partners | Office lease-up; partner employment | >100,000 sf interim leasing; off-campus anchor lab lease |
| 2028 | First cohort size and program list; undergraduate start date | Enrollment ramp speed | First cohort above ~300 students |
| Quarterly throughout | Wynwood / Allapattah rent and concession data vs. control area | Whether the expectations premium holds | Concessions narrowing before 2028 (premium holding) |
Additional detail on indicators and the model inputs each one updates is in the companion investment committee memo, Section 9.
10. Conclusion
CMU Miami is good news for Miami and a genuine long-term positive for Wynwood. It is not, on any reasonable reading of the evidence, a reason to reprice the urban core. The campus will add demand that is small relative to the market, arrives slowly, and concentrates within about two miles of NW 23rd Street. In a supply-elastic market, the benefit flows mostly to housing that cannot easily be replicated, older workforce rentals near the site, while new Class A product competes away its early premium and neighborhood retail and hotels must first absorb the loss of Mana's event economy.
For regional developers and investors, the winning posture is patient and specific: buy workforce exposure at baseline prices, develop product that serves the people CMU will actually bring rather than generic luxury inventory, treat interim and lab demand as anchor-led opportunities, and keep the CMU premium out of debt sizing, exit cap rates and near-term income. The next 24 months will resolve the most important unknowns, above all the on-campus housing plan and the first industry partners. Investors who track those signposts and update with discipline will be better placed than those who priced the headline.
For the full quantitative analysis, segment-level tables and model mechanics, see the companion investment committee memo, part of the complete research package, available here.
Notes
- Incremental effects and the counterfactual. Every rent, vacancy and demand figure in this report is the difference between a with-CMU path and a no-CMU counterfactual baseline for the same submarket and property type. The baseline rolls current inventory forward with the probability-weighted delivery pipeline (under construction 95%, permitted 60%, proposed 30%) and metro demand drivers. An effect of +1% means rents are 1% higher than they would otherwise have been, not that rents grow 1%.
- Metro scale comparison. Miami multifamily absorption of about 7,608 units against about 7,847 completions in the twelve months to Q2 2026, occupancy of 94.6% and effective rent roughly flat year-on-year are from MMG Real Estate Advisors' Miami Q2 2026 Market Report, which covers 16 Miami submarkets; pipeline estimates of roughly 15,000 to 19,000 units are from MMG (15,481 units, 7.3% of inventory) and MIAMI REALTORS/Yardi Matrix (19,131 units in Miami-Dade County, 9.7%). Wynwood concession observations are from Redfin listings as of October 2026. Source vintages are tabulated in the methodology appendix.
- Official vs. press facts. Official statements are from the CMU president's letter, the CMU Miami website and CMU News releases of September 30, 2026. Land-purchase price, acreage, closing date and address are from Mana's release and press reports (The Real Deal,Bisnow, CommercialSearch) and are not confirmed by CMU or Griffin. The September 29 closing date and the retained 15-plus acres are from Mana's release; the June closing of the majority of the deal and the one-year event continuation are from The Real Deal; the denied rumor of a deal at more than $700 million is from Bisnow, and the January 2026 date of the denial from The Real Deal.
- Enrollment ramp and employment. Central case: graduate students begin in 2028, undergraduates two years later, 60% graduate share at a full build-out of more than 3,500 students, about a ten-year ramp along an S-curve. Induced employment uses a multiplier on direct campus, partner and startup jobs consistent with published university economic impact studies, with only 25% of induced jobs treated as net-new households to avoid double counting with existing residents.
- Demand capture. Demand capture refers to the share of campus headcount that becomes off-campus rental demand. Central assumptions: 75% of undergraduates and 30% of graduate students housed on campus; group-specific persons per household; 60% of unmet student-bed demand captured by new purpose-built student housing, with the remainder spilling into conventional apartments (60% Class A, 40% Class B/C).
- Central estimate and likely range. Results come from a 5,000-draw Monte Carlo simulation with triangular distributions on key uncertain inputs (approval delay, enrollment ramp, on-campus housing share, partner uptake, startup formation, multiplier, competing supply, CMU-related supply, distance decay and rent-response parameters), with correlations among related inputs. The 'central estimate' is the P50 (median) outcome; the 'likely range' is the P10 to P90 interval, within which 80% of simulated outcomes fall. Ranges reflect input uncertainty only, not the data and calibration limitations in Note 11.
- Spatial allocation. Submarket shares come from a gravity model weighting inventory, exponential distance decay from the site, transit access, affordability relative to each population group's income (squared affordability ratio) and suitability by property type. Distance decay is among the most influential inputs; its sensitivity is shown in the model's Spatial Allocation and Sensitivity tabs.
- Bull case vs. simulated range. The named bull scenario sets every key input to its favorable value at once and produces about +6.0% for Wynwood Class B/C and +3.5% for Class A by 2033, well above the simulated P90 of about +2.4% and +1.0%. Simultaneous extremes are improbable under the simulation's input distributions.
- Sensitivity (tornado) chart. Each bar moves one input from its low to its high value with all others at central values, and reports the resulting 2035 asking-rent effect. Rent-response elasticity, meaning the rate at which rents adjust to the gap between actual and natural vacancy (alpha and V* in the model), and CMU-related private supply are among the largest drivers.
- Probability of any Class A benefit. The share of simulated outcomes with a positive Wynwood Class A asking-rent effect is about 97% in 2033, 41% in 2035 and 25% in 2036.
- Data and calibration limitations. Submarket inventories, rents, vacancies and pipelines are order-of-magnitude estimates; CoStar, Yardi Matrix submarket data, STR and AirDNA were not accessible. Rent-response parameters are literature priors pending calibration on 10 to 15 years of submarket history. Comparable-campus back-tests have not yet been run. Results should be read as relative magnitudes and timing rather than point forecasts. Full methodology, equations and the data vintage table are in the companion investment committee memo, part of the complete research package, available here.
This report is research, not investment advice. It relies on public information and analyst estimates as of October 2, 2026, and should be updated as CMU, the City of Miami and market data providers release new information.
The full analysis is available here.
Open the research package