

About this Series
This five-part series explores the craft of building Excel models with AI, from foundational skills to advanced techniques for developing full financial models.
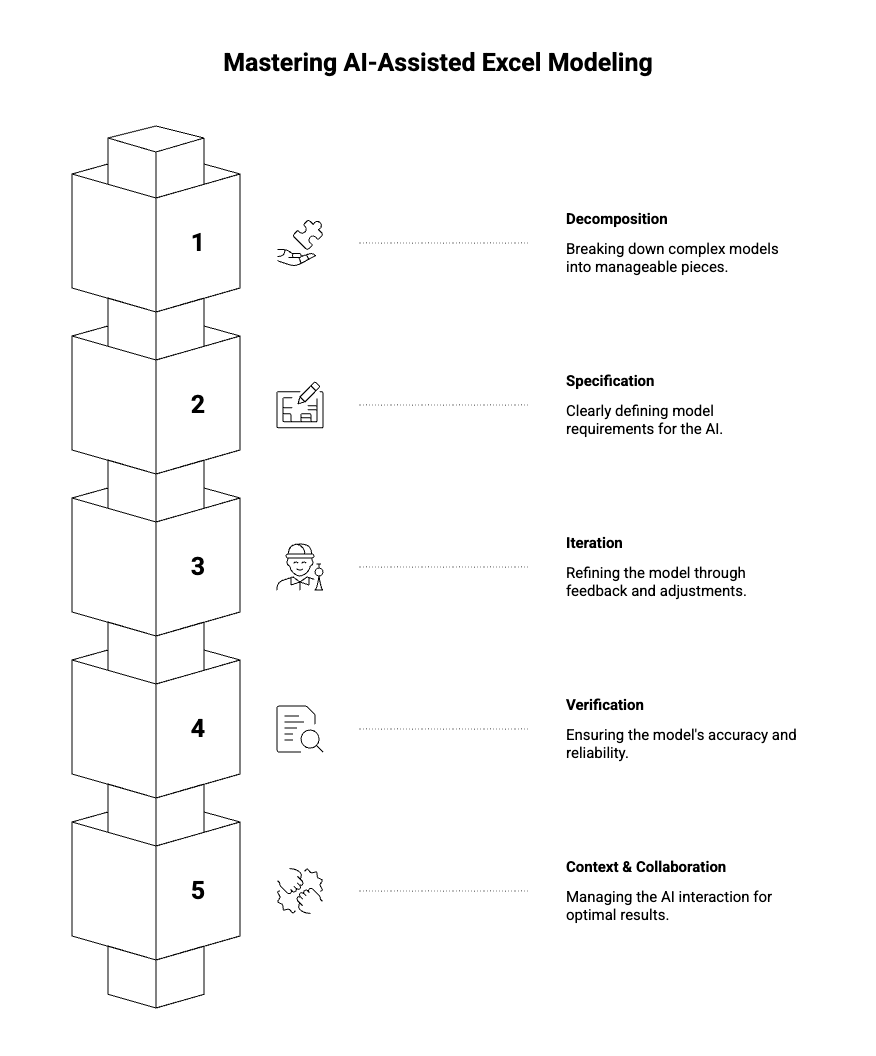
- Tutorial 0: Introduction
- Tutorial 1: Decomposition
- Tutorial 2: Specification
- Tutorial 3: Iteration
- Tutorial 4: Verification
- Tutorial 5: Context and Collaboration
Something has changed in how financial models get built.
For decades, the process was the same. You learned the mechanics — Excel functions, financial concepts, modeling conventions. You built templates, developed shortcuts, accumulated tricks. Speed came from experience, from having done similar models dozens of times before, from knowing exactly where to put the cursor and what to type.
Now there's a different path. You can describe what you want in plain language and watch a model take shape. Cash flows, debt schedules, waterfalls, sensitivities — structures that used to take hours can emerge in minutes.
But something curious happens when people first try this. The results are... uneven. Sometimes the AI produces exactly what you needed, and it feels like magic. Other times it misses the mark entirely, and you spend more time fixing its output than you would have spent building from scratch.
The difference isn't the AI. It's how you work with it.
A New Kind of Skill
Building models with AI isn't just traditional modeling with a shortcut bolted on. It's a different skill entirely.
The knowledge you need is different. Yes, you still need to understand finance and Excel. But you also need to understand how to communicate structure, how to break down complex problems, how to iterate through imperfect outputs toward something correct.
The workflow is different. Instead of row-by-row construction, you're working in cycles of description, generation, and refinement. The bottleneck shifts from "how do I build this?" to "how do I specify this clearly enough that the AI builds what I actually need?"
The failure modes are different. Traditional modeling fails through typos, wrong cell references, broken formulas. AI-assisted modeling fails through miscommunication, ambiguity, and the subtle gap between what you asked for and what you meant.
Getting good at this requires deliberate attention. Not just using AI tools, but studying how they work, noticing what succeeds and what fails, developing systematic approaches that produce reliable results.
That's what this series is about.
What We'll Cover
This is a five-part series on the craft of building Excel models with AI. Not tips and tricks — principles. The underlying patterns that separate frustrating experiences from productive ones.
The most common mistake is asking the AI to build too much at once. "Create a full acquisition model" sounds efficient, but it almost never produces good results. The model that comes back has structural problems, logical errors, and assumptions you didn't want — and untangling them takes longer than building correctly would have.
The solution is decomposition: breaking complex models into pieces the AI can handle well. But decomposition isn't obvious. How do you decide where to break? What sequence do you build in? How do you handle dependencies between pieces?
This tutorial develops a framework for thinking about decomposition — vertical (sections of a model), horizontal (time periods), and logical (what vs. how). It's the foundation everything else builds on.
Most failures happen before the AI generates anything. They happen in the gap between what you meant and what you said.
You ask for a "cash flow model" and get something organized completely differently than you expected. You ask for "NOI" and the AI includes line items you consider below the NOI line. You assume the AI knows your conventions — monthly periods, assumptions on a separate tab, certain formatting standards — and it doesn't.
This tutorial is about closing that gap. How to be precise without being verbose. How to specify structure, behavior, and constraints. How to catch your own ambiguities before they become problems in the output.
The first draft is never final. The skill is in how you refine it.
Some people iterate efficiently — each round of feedback produces clear improvement, and they converge on a good result quickly. Others go in circles, fixing one thing while breaking another, never quite getting to something they're happy with.
The difference is approach. This tutorial covers coarse-to-fine iteration (structure before logic before formatting), how to communicate what's wrong effectively, how to recognize when you're converging versus stuck, and when to abandon an approach and start fresh.
AI-generated models fail differently than human-built models. They're often structurally sound but logically flawed — formulas that look right but reference wrong cells, calculations that produce plausible numbers that happen to be incorrect.
Traditional review methods catch traditional errors. AI outputs require different scrutiny. This tutorial develops a verification framework: structural checks, formula tracing, numerical sanity tests, and edge case validation. It covers how to build verification into the model itself and how to develop confidence that what you have is actually correct.
Tutorial 5: Context and Collaboration
Underneath all the specific techniques is a meta-skill: managing the collaboration itself.
The AI only knows what you tell it. Every conversation starts fresh. How do you decide what context to provide? How do you describe existing work you want to modify? How do you choose between different modes of collaboration — having the AI generate versus advising versus working back-and-forth?
This tutorial covers the human side of AI-assisted modeling. Prompt patterns that work, knowing when to push forward versus take over manually, and developing your practice over time.
Who This Is For
This series assumes you already know how to build financial models. We won't explain what a DCF is or how IRR works. We're not teaching finance or Excel fundamentals.
We're teaching the layer on top — how to leverage AI effectively given that you already have modeling knowledge. Think of it as a multiplier on skills you've already developed.
If you've tried AI tools for modeling and found them hit-or-miss, this series is for you. If you've been skeptical because early experiments produced disappointing results, this series is for you. If you're proficient but want to understand systematically why some approaches work better than others, this series is for you.
The goal isn't to make you dependent on AI. It's to give you a new capability — one that complements your existing skills and expands what you can accomplish.
A Note on How We Got Here
The principles in this series didn't come from theory. They came from years of practice in financial modeling and engineering
We've spent countless hours building models with AI, observing what works, cataloging what fails, and refining approaches through trial and error. The tutorials represent condensed experience — the patterns that emerged after many iterations, the insights that only became clear in hindsight.
That said, this field is young. Best practices are still emerging. AI capabilities are evolving rapidly. What we present here is our current best understanding, not a final answer.
We expect these principles to hold up even as the technology improves. Decomposition, specification, iteration, verification, collaboration — these are fundamentals of working with any system that generates complex outputs from high-level instructions. The specific techniques may evolve, but the underlying framework should remain useful.
Getting Started
You don't need special tools to apply what you'll learn. Any AI assistant capable of generating Excel formulas and model structures will work. The principles are about how you interact with the AI, not which AI you use. That being said, most of our learnings are coming from building Apers.
What you do need is willingness to be deliberate. To think about your prompts before sending them. To analyze why things went wrong when they go wrong. To treat this as a skill to be developed, not just a feature to be used.
The payoff is substantial. Once these patterns become second nature, building models with AI stops feeling like a gamble and starts feeling like a genuine collaboration — one where you bring the judgment and the AI brings the leverage.
Let's begin.
Next in the series: [Tutorial 1: Decomposition — Why Building Everything at Once Fails]
About Apers AI
Apers AI was founded by researchers from Harvard, Yale, and MIT with backgrounds in quantitative asset pricing and institutional real estate. Our mission is to advance the science of capital deployment by applying autonomous agents and machine reasoning to real asset markets.


