The Transition Is the Most Mismodeled Event in Development
Construction-to-permanent financing is how ground-up and heavy-lift development deals move from a short, floating construction loan to a long, fixed permanent loan at stabilization. A ground-up pro forma tells a clean story: land, build, stabilize, hold. Most development underwriting stops at stabilization and reports a levered IRR. That leaves out the single event that decides whether the deal actually delivers those returns. The construction loan does not amortize into the hold. It matures. Somebody has to write a check, and the size of that check is what construction-to-perm modeling is for.
At stabilization, the construction facility (typically three to five years, floating, interest-only, drawn against monthly requisitions) has to be retired. A permanent lender writes a new loan against the finished, income-producing asset. If the permanent proceeds equal the outstanding construction balance, the transition is clean. If they do not, the sponsor covers the gap with equity. That gap is where deals that penciled at closing quietly break at stabilization.
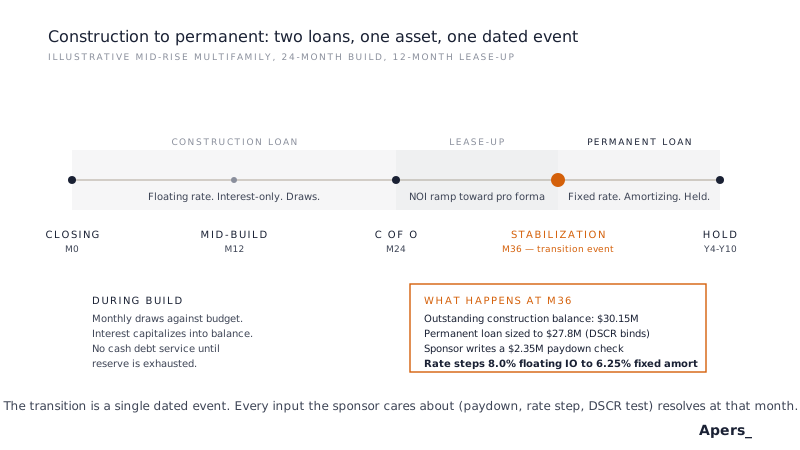
This article walks through the framework a proper construction-to-perm underwrite implements, then shows how DV-003, the Apers open institutional-tier model, runs that framework on the sheet.
The Outstanding Balance Is Not the Hard-Cost Budget
The most common modeling error is assuming the construction loan payoff equals the total hard-cost budget. It does not. The payoff at stabilization is the running balance of everything the construction lender advanced, which for a typical development is the sum of three components.
- Hard costs drawn. Monthly requisitions against the construction budget. On a proper S-curve, these are back-loaded through structural and MEP phases and taper into finishes.
- Soft costs and financing costs. Design, legal, lender fees, and origination all draw alongside hard costs on their own schedule.
- Capitalized interest. Because the property is not generating income during construction, the interest on the outstanding balance cannot be paid out of operations. It is capitalized, meaning it accrues into the loan balance. On a $28M hard-cost project at an 8% construction rate over an 18-month build, capitalized interest adds roughly $2.15M to the payoff. A model that omits it under-reports total project cost by about seven percent.
The interest reserve is the pot the construction lender sets aside on day one to fund that capitalization. Sized correctly, the reserve runs out at or just before stabilization. Sized incorrectly, either the sponsor covers debt service out of pocket during a lease-up delay or the reserve returns unused capital at refi. Both are signals the underwriting missed the timing. DV-003 sizes the reserve off the modeled draw curve and the modeled lease-up, not off a rule of thumb.
The Two Constraints That Size the Permanent Loan
A permanent lender sizes the new loan against two independent constraints, and the binding one wins. Getting this backwards is the second most common mistake in construction-to-perm modeling.
- LTV ceiling. Loan-to-value against as-stabilized appraised value. Agency multifamily tops out at seventy to seventy-five percent LTV. CMBS on commercial product typically caps at sixty-five to seventy. This constraint dominates when the asset appraises above the cost basis, which is the merchant-build assumption but rarely the reality in a compressed exit environment.
- DSCR floor. Debt service coverage ratio against stabilized NOI at the permanent rate. Agency floors sit at 1.20 to 1.25 depending on program. CMBS floors run 1.25 to 1.40 depending on asset quality. This constraint dominates when rates rise between closing and stabilization, which is the scenario every 2023 and 2024 development is now living through.
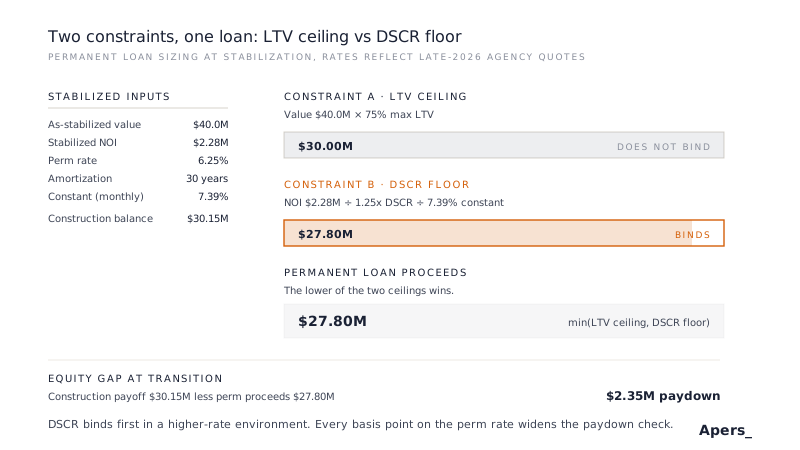
The framework asks the reviewer to compute both constraints in parallel and take the lower proceeds figure. Underwriting the deal off the LTV ceiling alone (a mechanical habit from a lower-rate era) systematically overstates perm proceeds and understates the equity gap. Every model that has to survive the current rate environment computes both.
The Equity Paydown Is a Real Line Item
When the permanent proceeds fall short of the construction payoff, the difference is a paydown check the sponsor writes at the refinance. That check is not modeled cash flow. It is fresh equity, either from the general partner's balance sheet, a capital call to existing limited partners, or a preferred equity sleeve raised specifically for the shortfall.
A proper model surfaces the paydown as a line in the sources-and-uses at the transition month, then flows it into the levered return calculation as additional equity invested. The IRR the sponsor pitched at closing was computed on the original equity check. The IRR the sponsor actually delivers is computed on the original check plus the paydown. On a deal where the paydown runs five to ten percent of total equity, the delivered IRR is one to two hundred basis points below the underwriting case. That is material.
The paydown also changes the waterfall. Preferred returns accrue on invested equity, and additional equity at refi extends the pref clock. Deals that were counting on a promote hit at year five sometimes do not clear the pref hurdle until year seven once the paydown is properly modeled. DV-003 flags this explicitly on deals with GP/LP structures.
The Rate Step Resets Returns for the Hold
The construction rate and the permanent rate are different instruments quoted off different curves. In a typical environment, the construction rate runs SOFR plus 250 to 400 basis points, floating monthly. The permanent rate is a fixed spread over the ten-year Treasury for agency or a corporate index for CMBS. When floating short rates sit above fixed long rates, as they have through most of 2023 through 2026, the permanent rate is below the construction rate and the sponsor benefits from the transition.
The rate step matters two ways in the model. First, cash debt service drops sharply the month after transition, which is the largest single driver of the year-one stabilized cash-on-cash. Second, the permanent loan amortizes on a thirty-year schedule, so principal reduction begins accruing to the sponsor from day one of the hold. Interest-only construction debt reduces no principal. Modeling this matters when the sponsor is projecting refinance-out or sale returns three to five years past stabilization.
The framework treats the rate step as a discrete event, not a smoothed average. Construction rate applies through the transition month. Permanent rate applies from the month after. Any model that blends the two rates across the transition period misses the stabilized cash flow the sponsor is going to report to the LP.
How DV-003 Runs the Framework
DV-003 is the Apers open institutional-tier model that implements this framework on a single spreadsheet page. The construction section captures the loan terms and the draw curve, computes the running balance including capitalized interest, and reports the outstanding payoff at any user-selected stabilization month. The perm-sizing section computes the LTV ceiling and the DSCR floor in parallel, picks the binding constraint automatically, and surfaces the proceeds figure alongside the constraint that set it. The transition section runs the sources-and-uses at the refinance month, computes the paydown check (or the recapture, if perm proceeds exceed the payoff), and reports the blended cost of capital across the construction and permanent periods.
The model deliberately excludes several things a full development pro forma would include. There is no hard-cost draw distribution logic beyond a curve archetype, because the goal is transition modeling and a project cost tracker is the right sheet for line-item draw discipline (see DV-004). There is no lease-up absorption module, because the assumed stabilization NOI is a required input; if the reviewer wants to stress absorption timing, that lives in the source pro forma. There is no equity waterfall module, because waterfalls belong in the sponsor's model of record, not in the debt-transition tool. Each omission traded scope for solvability at the transition tier.
When DV-003 Stops Being Enough
DV-003 is a debt-mechanic tool. It answers the transition question well and it stops there. Pick the model that matches the broader question being asked:
- Underwriting a ground-up project end to end: DV-001 Ground-Up Development
- Underwriting an adaptive reuse or redevelopment: DV-002 Redevelopment and Adaptive Reuse
- Tracking actual draws and change orders through the build: DV-004 Construction Project Cost Tracker
- Bridge-to-perm on a heavy-lift multifamily repositioning: AQ-141 Multifamily Opportunistic Pro Forma
The handoff preserves the DV-003 workspace. Construction loan terms, draw curve, stabilization month, and stabilized NOI all transfer directly to the upstream development model. The larger model absorbs DV-003 as its debt-transition sub-page and adds the entitlement, construction schedule, and lease-up mechanics that the transition tool intentionally leaves out.
Related Models
DV-001 Ground-Up Development is the upstream pro forma that generates the construction debt DV-003 tracks. DV-001 models the whole project from land close through stabilized hold; DV-003 zooms in on the single event where the construction facility retires and the permanent loan takes its place. Teams that underwrite ground-up deals use them side by side, with DV-003 as the sizing check when the deal is stress-tested against a rising rate environment.
DV-002 Redevelopment and Adaptive Reuse is the adjacent development strategy. DV-002 assumes a merchant sale at stabilization retires the construction loan through sale proceeds. When the sponsor toggles from merchant to hold, DV-003 is the next sheet on the desk. The two models share draw curve and interest reserve mechanics but diverge on the exit treatment.
DV-004 Construction Project Cost Tracker is the post-close operations tool. DV-004 tracks actual monthly draws, change orders, and contingency burn against the underwritten budget. When it comes time to model the transition, the running balance DV-004 reports feeds directly into the outstanding-payoff input in DV-003. The two live on either side of the stabilization date.