About This Model
TL;DR
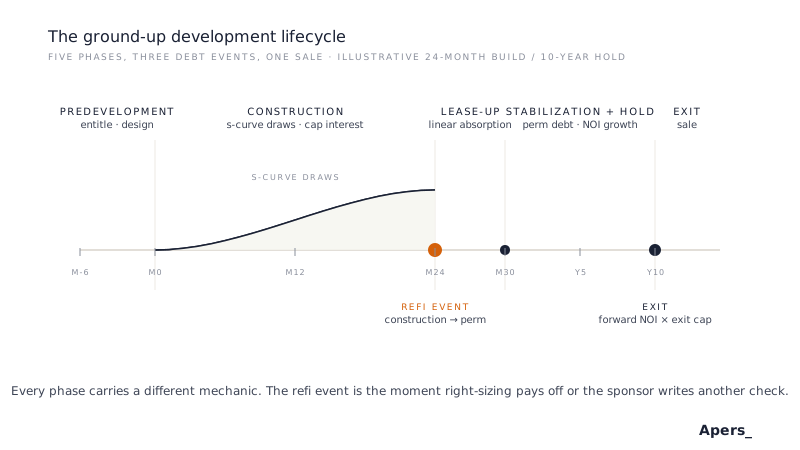
- Ground-up development is a five-phase project: predevelopment, construction, lease-up, stabilization, exit. Every phase carries different mechanics. A model that treats them uniformly mis-sizes at least one of them.
- DV-001 uses a closed-form capitalized interest formula (average outstanding balance × construction rate × months) instead of a circular monthly reference. Trades a small amount of precision for full transparency and Google Sheets portability.
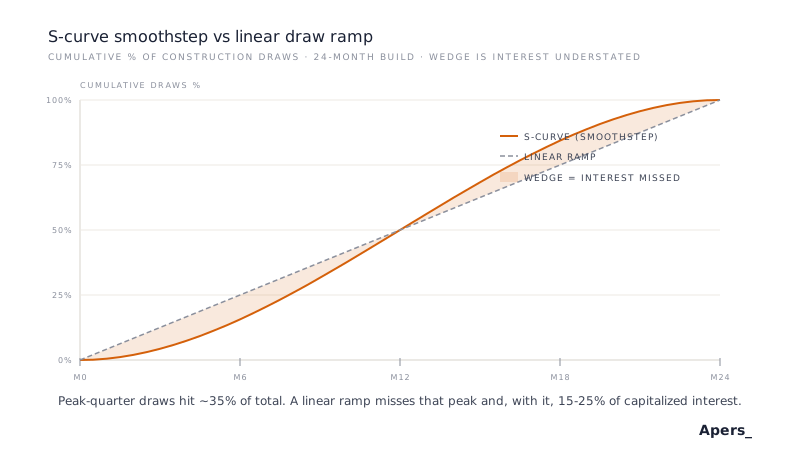
- Construction draws follow an S-curve smoothstep distribution, cumulative% = (t/T)² × (3 − 2t/T), rather than linear or front-loaded. A linear ramp understates mid-project interest expense by 15 to 25 percent on a typical 24-month build.
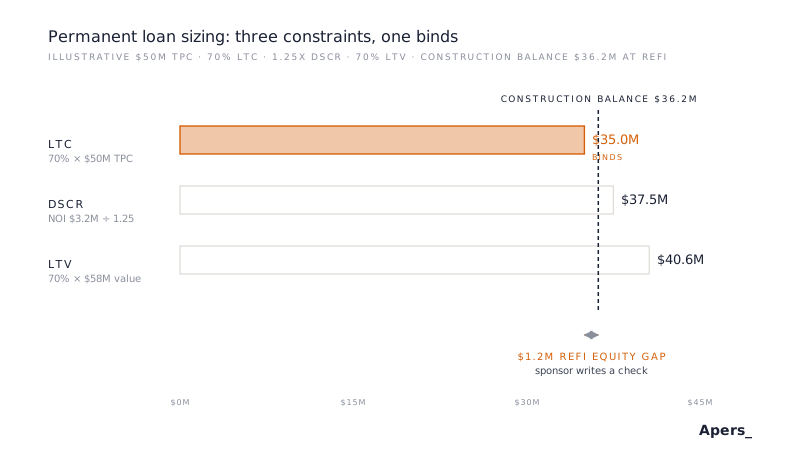
- The permanent loan at refinance is sized as MIN(LTC max, DSCR max, LTV max). The binding constraint sets proceeds. If perm proceeds are less than the outstanding construction balance, the sponsor writes a gap-equity check at refi.
- Trade-level hard cost itemization (site work, structure, envelope, MEP, finishes) lets the sponsor stress specific trades against contractor bids and allocate contingency to the trades that actually need it.
- Forward NOI (Year N+1) drives sale valuation, matching the buyer's cap-rate convention. The pro forma runs 11 years to support a 10-year hold without a phantom terminal year.
- DV-001 targets single-phase, single-tranche-takeout deals with a fixed-rate amortizing perm loan and a single sale at exit. No GP/LP waterfall, no tax modeling, no construction phasing, no tenant-level commercial rollover. Each omission traded scope for solvability at IC quality.
Why Ground-Up Development Breaks Acquisition Templates
Every acquisition-model assumption breaks on a ground-up development deal. An acquisition starts with an asset producing NOI on day one; the underwriting question is how much NOI, at what cap, with what upside. Ground-up development starts with dirt. Every operating dollar is a projection two years out. Every dollar of interest during construction is capitalized into the loan balance rather than paid from cash flow. The refinance event that transitions from construction to permanent debt is the moment of truth. Right-sized right, the sponsor takes gap equity back at stabilization. Right-sized wrong, the sponsor writes another equity check just to hold the deal.
An acquisition model with a construction-period bolt-on tries to paper over these differences by pretending construction is a delayed acquisition. It fails on capitalized interest, which does not hit cash flow but grows the loan balance in a way the acquisition model has no mechanic for. It fails on draw timing, which drives peak equity and cumulative interest expense. It fails on the refi event, which the acquisition model does not model as an event at all.
DV-001 is a purpose-built ground-up model. Every design choice below traded scope for solvability at IC-quality. This piece walks each of those choices, then names what the model deliberately excludes and why.
Design Choice: S-Curve Draws with Closed-Form Capitalized Interest
Two decisions travel together. The first is that construction spends money on an S-curve, not linearly. The second is that we compute the interest that S-curve accrues in closed form.
The S-curve
DV-001 uses a smoothstep distribution: cumulative percent of draws at time t equals (t/T)² × (3 − 2t/T), where T is total construction months. At t=0 the curve is flat, at t=T/2 it is steepest, at t=T it flattens back to 100 percent. The property this preserves is that draws in the first quarter of construction are approximately 10 percent of total, peak-quarter draws are approximately 35 percent, and final-quarter draws taper back to approximately 10 percent.
That matches how general contractors sequence work. Mobilization and site work at the start. Structure ramp through months four to eight. Envelope, MEP, and finishes overlapping through months ten to twenty. Punch and close-out at the end. A linear ramp would put 25 percent of draws in the first quarter and understate the mid-project peak interest expense by 15 to 25 percent on a typical 24-month build. On a $50M project at 8 percent construction rate, that is $250K to $500K of capitalized interest the linear model misses, all of which grows the construction balance and reduces refi proceeds.
Closed-form vs monthly grid
Given the S-curve, capitalized interest can be computed two ways: build a monthly grid of balance × rate × 1/12 and sum, or use a closed-form approximation. The monthly grid is more precise but creates circular references (each month's balance depends on prior draws plus prior interest, and prior interest depends on prior balance). Circular references are solvable in Excel but fragile: they break in Google Sheets entirely, they slow open times, and they surface as errors when a downstream formula edit propagates.
DV-001 uses the closed-form: average balance during construction equals total draws × 0.5, capitalized interest equals average balance × construction rate × construction months / 12. The average-balance factor of 0.5 is technically the linear-ramp average; the true S-curve average is approximately 0.48. The error is a fraction of a percent of total draws and rounds out inside the contingency line.
The monthly grid is shown alongside for full transparency, but it does not feed back into the total project cost (TPC) calculation. That decision keeps the model deterministic, Google Sheets-portable, and readable without a two-hour audit.
Design Choice: Right-Sizing the Permanent Loan
At stabilization, the construction loan pays off and a permanent loan replaces it. The permanent loan is sized against three constraints, and the binding constraint sets the proceeds.
- LTC ceiling. A percentage of total project cost. Lenders cap at 65 to 75 percent for multifamily, sometimes lower for commercial. On a $50M TPC deal at 70 percent LTC, the ceiling is $35M.
- DSCR floor. Stabilized NOI divided by the permanent debt service must clear the lender's DSCR floor, typically 1.20x to 1.30x for multifamily perm. If stabilized NOI is $3.2M and the DSCR floor is 1.25x, the maximum debt service is $2.56M. Given the perm rate and amortization, that back-solves to a maximum loan.
- LTV ceiling. A percentage of the stabilized value (stabilized NOI divided by the stabilized market cap rate). Lenders cap at 65 to 75 percent for multifamily perm. If stabilized value is $58M at a 5.5 percent cap, LTV at 70 percent is $40.6M.
The three constraints usually disagree. LTC is often binding on a well-underwritten deal (the lender caps at cost basis, and cost basis is lower than value). DSCR is binding when perm rates are high or when the deal underwrites to thin margins. LTV is rarely binding on new construction because as-completed value typically exceeds cost by more than the LTV ratio would allow.
Design Choice: The Refi Equity Gap
If the permanent loan proceeds are less than the outstanding construction balance at refinance, the sponsor writes a check for the difference. That check is called the refi equity gap, and it is one of the most-underestimated line items in ground-up underwriting.
The gap appears because construction lenders size to cost (LTC) plus draws include capitalized interest, while permanent lenders size to stabilized value (LTV) or stabilized cash flow (DSCR). If the project came in under-rented or over-budget, the perm sizing constraints are lower than the construction balance, and the sponsor closes the gap with equity.
DV-001 models the gap as an explicit line in the refi cash event, injected into the equity accumulator so returns reflect the actual equity outlay. A sponsor who underwrites the gap at zero and hits a real gap at refi is a sponsor whose IRR presentation was never real. The model flags non-zero gap as a warning row so the underwriter cannot miss it.
Note that the reverse case, perm proceeds greater than construction balance, produces a refi distribution to the sponsor (cash-out at stabilization). This is the base-case outcome on a well-underwritten deal and the reason ground-up sponsors accept the risk in the first place. DV-001 handles both cases through the same refi cash-flow line.
Design Choice: Trade-Level Hard Cost Itemization
Hard cost in DV-001 is not a single dollar figure. It is broken into five trade categories that must sum to 100 percent: site work, structure, envelope, MEP, and finishes. The itemization drives three specific underwriting decisions.
First, contingency allocation. Not every trade carries the same overrun risk. Site work runs long when subsurface conditions surprise, MEP runs long when the local labor market tightens, finishes run long when a supplier defaults. A 5 percent overall contingency line hides which trade the contingency is really covering. Trade-level itemization lets the sponsor and the lender see the exposure.
Second, stress against contractor bids. When the general contractor's guaranteed maximum price comes in, the sponsor can compare it trade-by-trade against the underwritten budget. A GC that beats the site work line but overshoots the MEP line by 15 percent is a bid the sponsor can negotiate. A single blended hard-cost line loses that comparison entirely.
Third, value engineering. If the deal misses returns by 50 basis points of IRR, the sponsor needs to know which trade to attack. Cutting finishes 10 percent might close the gap; cutting structure 10 percent might collapse the building. Trade-level itemization tells the sponsor what is negotiable.
DV-001 requires the five trade percentages to sum to 100 and flags any deviation. The default allocations are set to typical multifamily wood-frame construction (site 8%, structure 40%, envelope 18%, MEP 22%, finishes 12%). Commercial construction users should reset these to their asset type.
Design Choice: Forward NOI as the Exit Valuation Base
A buyer at exit is not paying for last year's NOI. A buyer at exit is paying for next year's NOI. DV-001 codifies that convention: sale price at exit equals forward-year NOI divided by exit cap rate, minus cost of sale.
The mechanical implication is that a 10-year hold requires an 11-year pro forma. Year 11 NOI drives the Year 10 sale valuation. A pro forma that stops at Year 10 has to either extrapolate a phantom NOI or use trailing NOI, and either choice introduces a valuation error the buyer will not accept in diligence.
DV-001 extends the P&L to Year 11 by default. On shorter holds (3, 5, 7 years) the extra years are computed but ignored by the sale calculation; on the maximum 10-year hold, Year 11 is the valuation base. This design decision means the model works across the full range of hold periods a ground-up sponsor typically underwrites without a version fork.
Cost of sale is a percentage of gross proceeds (typically 2 to 3 percent for a professionally marketed asset) that captures broker fees, transfer taxes, and closing costs. It reduces net proceeds to the sponsor and the LP.
Design Choice: Equity-First Funding During Construction
During construction, the sponsor's equity funds first and the construction loan draws second. Only when equity is fully in does the loan begin drawing. This is standard construction lender behavior (equity is the first-loss capital and must be at risk before the lender takes exposure), and DV-001 models it directly.
The mechanical consequence is that peak equity outlay occurs partway through construction, not at stabilization. On a $50M TPC with 30 percent equity ($15M), the equity check is written across the first roughly 8 to 10 months of construction, then the loan takes over. If the sponsor plans a JV/LP raise, the LP capital call cadence has to match this front-loaded outlay, not spread evenly across the construction period.
The model surfaces peak equity and total equity separately. Total equity is what appears on the fundraising deck; peak equity is what the sponsor and the JV actually need to have available. A sponsor who conflates them will be short cash at month 8.
What We Deliberately Left Out
DV-001 makes a set of explicit scope decisions. Each was made to keep the model solvable at IC quality for the target deal type (single-phase, single-tranche-takeout ground-up). Deals outside those boundaries belong in a different model.
- No GP/LP equity waterfall. DV-001 returns single-sponsor levered and unlevered IRR, equity multiple, cash-on-cash, and development margin. Any promote / hurdle / catch-up structure has to be modeled separately (typically in CS-001, the Multi-Class Equity Waterfall). Layering a waterfall on the ground-up model doubled the complexity without changing the pre-promote economics, so we split it out.
- No tax modeling, depreciation, or after-tax IRR. Depreciation on a ground-up building is a real driver of after-tax returns, especially for a taxable sponsor. DV-001 returns pre-tax metrics only. Tax modeling requires jurisdiction, sponsor tax basis, and holding-entity structure that are not universal enough to hard-code.
- No construction phasing. The model assumes a single delivery date for the entire project. Multi-phase developments (Phase 1 delivering while Phase 2 is still under construction) require different draw schedules per phase, different stabilization dates, and different exit strategies per phase. Those belong in a phased-development template.
- No tenant-specific rollover in commercial mode. The commercial mode uses a blended base rent and blended expense reimbursement. Multi-tenant office or retail with lease abstracts belongs in AQ-201 orAQ-301, not here.
- Single exit at end of hold. No partial sales, no recapitalizations, no supplemental financings, no hold-extension scenarios. Ground-up sponsors sometimes recap mid-hold to return capital; that is a separate underwriting exercise and belongs in a dedicated recap model.
- Approximated capitalized interest. As noted above, the closed-form capitalized interest is an approximation. The monthly grid is available for transparency but does not feed back into TPC. This trades a small precision loss for full model transparency and Google Sheets portability.
How to Use the Model
DV-001 targets IC-ready ground-up underwriting: investment committee memos, JV/LP fundraising packs, sponsor pencil checks, and lender DSCR/LTV stress tests. The typical workflow is four steps.
Step 1: Set the program. Multifamily vs commercial mode, unit count or NRA, rent/expense assumptions, timing (predev / construction / lease-up months, hold years). These inputs drive the operating pro forma and set the target NOI for stabilization.
Step 2: Build the development budget. Land cost, hard cost per SF, trade-level itemization, soft cost percentage, contingency, FF&E, and developer fee. Sum to total project cost (TPC). This is where the underwriting bites; a change to hard cost per SF flows through every downstream metric.
Step 3: Size the financing. Construction LTC, construction rate, permanent rate, amortization, and target DSCR / max LTV for perm sizing. The model computes capitalized interest (closed-form), refi loan sizing (MIN of LTC, DSCR, LTV), and any refi equity gap.
Step 4: Read the returns. Untrended and trended yield-on-cost, development spread, levered and unlevered IRR, equity multiple, profit, stabilized DSCR, debt yield, development margin. Cross-check the sensitivity tables (untrended YoC across hard cost × rent, and levered EM across exit cap × rent) to see whether the returns survive stress.
The output cross-checks are as important as the base case. A deal that pencils at the base case but degrades sharply on the sensitivity tables is a deal that survives only if the assumptions hold. Ground-up assumptions almost never hold cleanly. Underwrite to the sensitivity, not to the point estimate.
Related
DV-002 Redevelopment / Adaptive Reuse is the conversion analog: same construction-draw mechanics but starting from an existing shell rather than raw land, with entitlement risk priced as a specific line item.DV-003 Construction-to-Perm Loan Transition is the debt-side deep dive on the refi event that DV-001 models as a single line; use DV-003 when the perm sizing is complex enough to need its own sensitivity.DV-004 Construction Project Cost Trackeris the operational cost ledger that runs alongside DV-001 during construction: DV-001 sets the budget, DV-004 tracks actuals against it.AQ-141 Multifamily Opportunistic Pro Forma handles the heavy-lift acquisition case that shares mechanics (S-curve absorption, bridge-to-perm refi) but starts with an existing asset rather than a ground-up build.