Why Anchored Retail Needs Its Own Model
Underwriting an anchored retail shopping center starts with a scenario like this: a grocery-anchored neighborhood center in the suburbs. One-hundred-and-thirty-thousand square feet of GLA. A Kroger on a twenty-year lease at $12 per SF NNN, a small-format fitness co-anchor at $18, fourteen shop tenants running from a nail salon to a quick-service restaurant, and two pad sites (a regional bank and a burger franchise). Ninety-two percent occupied. The broker quotes it at a 6.75 going-in cap.
Nothing in a generic pro forma template handles this deal correctly. A single blended rent per SF misprices the credit floor. A single flat recovery assumption misprices the NOI. Ignoring percentage rent leaves the QSR pad's upside on the table. Modeling the anchor as if it rolled inside the hold overstates re-lease risk. Anchored retail is a portfolio of four different lease economies sitting inside one building envelope, and a working model has to reflect that.
This article walks through the framework an institutional retail acquisition model has to implement: the four-segment tenancy stack, the anchor's role as a traffic generator rather than a rent generator, the four recovery types and how they compound differently on NOI, and the percentage-rent mechanic that turns tenant sales growth into landlord income. Then it shows how AQ-301, the Apers open anchored retail model, runs that framework across up to fifty tenants and ten years of cash flow.
The Four-Segment Tenancy Stack
Every anchored retail center is really four rent rolls stacked inside one PID. The segments do not just have different rents; they have different lease terms, different recovery structures, different renewal probabilities, and different roles in the center's economic thesis. A working model treats each segment as its own inventory, with its own defaults.
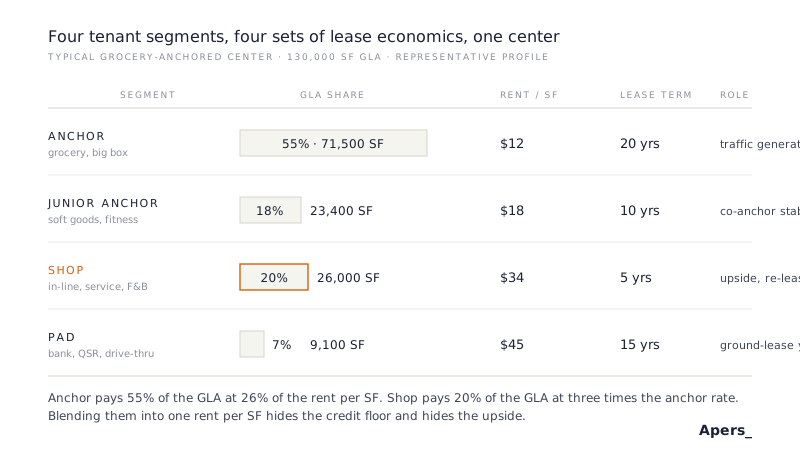
Anchor is the grocery store or big-box tenant. It sits on the longest lease in the center (fifteen to twenty-five years plus options), pays the lowest rent per SF, and typically operates on straight NNN recovery. Its credit profile is investment-grade or close to it. In a working model, the anchor is more like a bond than a lease.
Junior anchor is the second-largest box: a soft-goods retailer, a fitness concept, a home-goods store. Ten- to fifteen-year lease, mid-range rent, often with cotenancy clauses tying its rent obligation to the anchor staying open. Junior anchors provide co-anchor draw and diversify the traffic story.
Shop is the in-line tenancy: nail salons, sandwich shops, mobile phone stores, franchise service concepts. Five- to seven-year leases, the highest rent per SF (often two to three times the anchor rate), and the highest turnover. Shop revenue is where the business plan lives, because shop leases roll inside a standard hold and can be marked to market.
Pad is the outparcel: a bank, a drive-thru QSR, a specialty medical concept. Typically on a ground lease of ten to twenty-five years, sometimes structured as a build-to-suit. Pad rents are the highest per SF in the center, but the SF is small. Pads contribute stable yield and, when the center is repositioned, they contribute optionality.
Anchor Economics Are Not Rent Economics
The anchor pays the lowest rent in the center by design. In a $12 NNN grocery lease, the landlord is not collecting rent on 55% of the GLA; the landlord is collecting a subsidy for the traffic the grocery brings to the other 45%. That subsidy shows up as higher achievable shop rent and lower shop vacancy.
A model that treats the anchor as a rent-generating tenant will consistently recommend the wrong asset. It will overweight centers where the anchor pays more per SF (which usually means the anchor is a weaker credit or the deal is a redevelopment) and underweight centers where a dominant grocer is on a legacy lease at a below-market rate. The latter is often the better acquisition, precisely because the anchor is doing its job as a traffic generator rather than as a rent line item.
The framework has to price two anchor risks separately. First, anchor renewal risk: when the current anchor lease expires, does the anchor renew, and at what rent? Second, anchor go-dark risk: even inside the term, does the anchor keep operating, and if it goes dark do the shop leases still perform? Cotenancy clauses in the shop leases tie the second question to real cash flow, and a working model has to be able to run the center under an "anchor dark" scenario without collapsing.
Four Recovery Types, Four NOI Shapes
Base rent is only half of what a retail landlord collects. The other half is recovery income: the tenant's reimbursement for common area maintenance, real estate tax, and insurance. Retail centers routinely carry a mix of four recovery structures across their rent roll, and each structure passes a different share of operating expense inflation to the tenant.
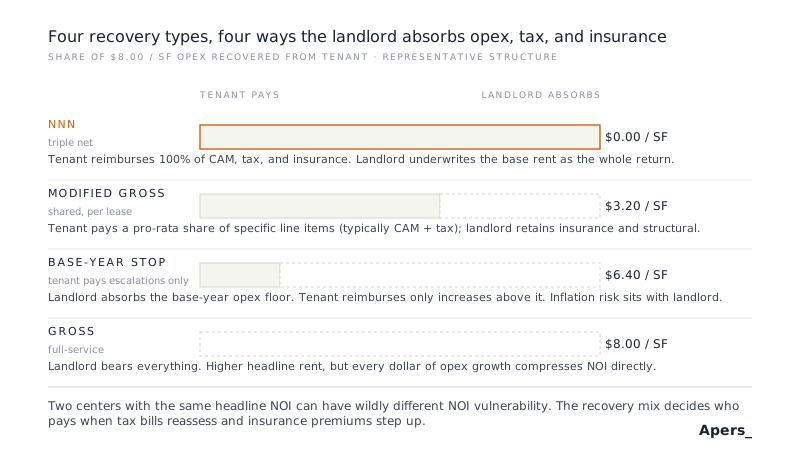
NNN (triple net) is the default for anchors and most credit shop tenants. The tenant reimburses its pro-rata share of CAM, real estate tax, and insurance in full. The landlord collects base rent and passes every dollar of opex growth through to the tenant. NOI is protected against opex inflation.
Modified gross narrows the pass-through. The tenant pays a share of specific line items (typically CAM and tax) but not others. Landlord retains insurance, structural, and often roof-and-parking capital. This is common on junior anchor leases and on shop leases negotiated during a soft leasing market.
Base-year stop passes only the year-over-year escalation. The landlord absorbs the base-year opex floor for the life of the lease, and the tenant reimburses only increases above that floor. The recovery income line grows slowly, and the base-year expense sits inside NOI. When property tax reassesses on a sale or insurance premiums step up materially, base-year-stop tenants absorb almost none of it.
Gross (full-service) means the tenant pays a single all-in rent and the landlord bears everything. Rare in modern anchored retail leases; most often seen in legacy leases that never got restructured. The gross rent is nominally higher than the NNN equivalent, but every dollar of opex growth compresses NOI directly.
A center with 80% NNN tenancy and 20% modified gross has a very different NOI trajectory from a center with 50% base-year-stop tenancy, even if the year-one NOI matches to the dollar. Recovery structure is where the second-order economics live, and any model that collapses it to a single "opex recovery ratio" is generating plausible-looking numbers that will not survive the first tax reassessment.
Percentage Rent as the Upside Share
Percentage rent is the mechanic that lets the landlord share in tenant sales growth without renegotiating the lease. The tenant pays base rent as usual, but on top of the base rent the lease specifies a breakpoint (typically calculated as base rent divided by a percentage) and an overage rate. When the tenant's annual sales cross the breakpoint, the tenant pays the overage rate on every dollar of sales above it.
The mechanic is most valuable on tenants whose economics are volume-sensitive: restaurants, QSR pads, franchise service, specialty grocery. A well-performing smoothie franchise at $650,000 in sales against a $400,000 natural breakpoint pays percentage rent on $250,000, and at a 6% overage rate that is $15,000 of additional landlord income on the same lease. Across a full shop and pad roster, percentage rent can add 3% to 8% to headline income at a stabilized center, and materially more at a center in the middle of a leasing lift.
Percentage rent also functions as a soft inflation hedge. When food and consumer prices rise, tenant sales rise in nominal terms, and percentage rent tracks. A model that ignores percentage rent understates the natural inflation protection of a healthy retail center and misprices exactly the tenants (QSR pads, specialty food, service concepts) where the mechanic contributes most.
How AQ-301 Runs the Framework
AQ-301 is the Apers open model that implements this framework across up to fifty tenants and ten years of monthly cash flow. Tenant-level inputs let each lease carry its own base rent, escalation schedule, recovery type, breakpoint, and sales figure. The tenant table groups by segment, so anchor, junior anchor, shop, and pad each roll up separately in the results panel and can be stress-tested independently.
The recovery engine handles all four structures without a workaround. NNN tenants reimburse the full pro-rata share. Modified-gross tenants reimburse the specific line items flagged on the lease. Base-year-stop tenants reimburse only escalations above their individually specified base-year floors. Gross tenants reimburse nothing. Property tax reassessment on sale is modeled explicitly, so the NOI hit that lands on base-year-stop and gross tenants shows up in the correct year rather than getting smoothed away.
Percentage rent runs off tenant-level sales inputs. Each shop or pad tenant carries a starting sales-per-SF figure, an annual sales growth rate, and an overage rate. The breakpoint is calculated from base rent by default (natural breakpoint) but can be overridden. Cotenancy clauses attach to shop leases and can be triggered by an "anchor dark" scenario switch, which converts the affected tenants to reduced rent or termination-right status.
The model deliberately excludes a few things a fully custom institutional workbook would include. Debt is sized as a single senior tranche against LTV, LTC, and DSCR constraints; there is no mezzanine, no CMBS-style A/B waterfall, and no partial-term interest-only overlay beyond a simple IO period. The distribution waterfall is a straight preferred-return plus promote at up to two tiers; multi-class LP structures live in CS-001 Multi-Class Equity Waterfall and get pulled in when the deal actually needs them. Redevelopment capex is modeled as a single reserve draw schedule; a heavier lift belongs inAQ-331 Retail Value-Add Pro Forma.
Each omission traded scope for solvability at the ten-year, fifty-tenant, four-recovery scale. Adding any of them would move AQ-301 from a working IC pro forma to a bespoke workbook that needs a modeler to maintain.
When AQ-301 Stops Being Enough
AQ-301 is designed for stabilized to light value-add anchored retail. It stops being the right model when the business plan gets heavier than that:
- Real repositioning, aggressive re-tenanting, or outparcel development:AQ-331 Retail Value-Add Pro Forma
- A multi-class LP structure with waterfall promotes beyond a two-tier straight promote:CS-001 Multi-Class Equity Waterfall
- A pipeline of retail teasers before you commit to a full underwrite:AQ-300 Retail Shopping Center Pocket
- A batch of teasers across asset classes ranked against each other:AN-004 Bulk Deal Screening Workbook
The handoff to the value-add sibling is direct. Tenant roster, segment tags, recovery types, sales figures, and debt inputs all transfer to AQ-331 without re-keying. The value-add model then expands what AQ-301 held constant: phased redevelopment capex, downtime for re-tenanting shop bays, TI and LC by lease event, and a repositioned stabilized NOI at exit.
Related Models
AQ-300 Retail Shopping Center Pocketis the pocket-tier sibling. Same asset class, same anchor-and-shop framing, but collapsed to two GLA buckets and a thirty-minute triage tab so a reviewer can screen a teaser without a rent roll. AQ-300 is what runs before you commit to building an AQ-301 model for a given center.
AQ-331 Retail Value-Add Pro Forma is the higher-strategy retail model. Use it when the business plan is real repositioning, heavy re-tenanting, or outparcel development rather than a stabilized acquisition. AQ-301 will underwrite the center as it stands; AQ-331 is where the value-creation math gets built.
AQ-201 Office Full-Service Lease Rollover is the institutional sibling for a different asset class. Similar tenant-level, recovery-aware, IC-ready pro forma discipline, but built around full-service office leases with escalation clauses and rollover risk instead of anchor dynamics and percentage rent. Useful reference when the desk works across retail and office in parallel.