Why LIHTC Screening Is a Different Game
Screening a 4% or 9% Low-Income Housing Tax Credit (LIHTC) deal is a different exercise from screening a market-rate development. A market-rate development screener asks one question: can rent, cost, and exit combine into a levered IRR that clears the target. Every input feeds a single answer. A LIHTC screener asks a different question, because LIHTC deals do not clear on IRR. They clear on whether the capital stack closes.
Rent is capped by AMI. Exit is regulated by a 15-year compliance covenant, and often longer through extended-use restrictions. The developer does not underwrite unlevered yield-on-cost against a market stabilization curve. The developer underwrites whether tax-credit equity plus permanent debt plus soft sources cover total development cost, and whether the developer fee at the bottom of the sources column is large enough to justify the sponsor's time. Every screening decision reduces to one arithmetic question: do the numbers close.
That question decomposes into three sub-questions. Which credit type is the deal chasing, 4% or 9%. How much tax-credit equity does the eligible basis actually produce. What fills the gap between that equity and total development cost. This article walks through the framework, then shows how TX-101, the Apers open LIHTC screening model, runs it end to end.
The 4% vs 9% Credit Divide
The credit type is not a modeling toggle. It sets the entire structure of the deal, and picking the wrong one is how a developer wastes six months chasing an allocation that was never going to close.
The 9% credit is competitive. State housing agencies allocate a fixed annual pool through a qualified allocation plan, and applications are routinely oversubscribed two-to-one or worse in strong markets. A 9% deal that wins allocation funds roughly 60 to 70 percent of total development cost through tax-credit equity, which lets the stack close with modest permanent debt and, often, a piece of soft financing from a local housing trust or HOME funds. The 9% is the workhorse for new construction of purely affordable projects where the sponsor cannot generate enough soft sources to close a 4% deal.
The 4% credit is by-right. Any project financed with at least fifty percent tax-exempt volume-cap bonds qualifies automatically, no competition. The tradeoff is that the 4% credit funds only about 25 to 35 percent of total development cost. Closing a 4% deal requires enough soft sources, subordinate debt, or project income to fill a much larger gap. In practice the 4% is used for larger deals in high-cost markets, mixed-income structures where market-rate units carry a share of the stack, and preservation or rehab where existing cash flow can service more debt.
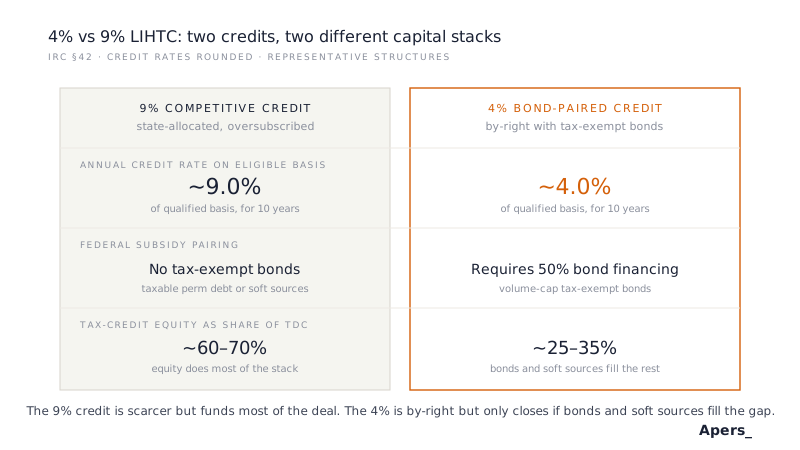
A properly framed screening starts by naming the credit type before touching any numbers. A 9% deal tests whether the sponsor can win the allocation and whether the pro forma survives a competitive scoring criteria in the state's qualified allocation plan. A 4% deal tests whether the sponsor can assemble bonds, soft sources, and enough operating cash flow to cover the much larger gap the 4% equity leaves behind. Different tests, different sensitivities, different exit outcomes.
From Eligible Basis to Tax Credits
The credit calculation is a chain, not a formula. Getting each step right is where a proper screener earns its keep, because errors compound multiplicatively down the chain.
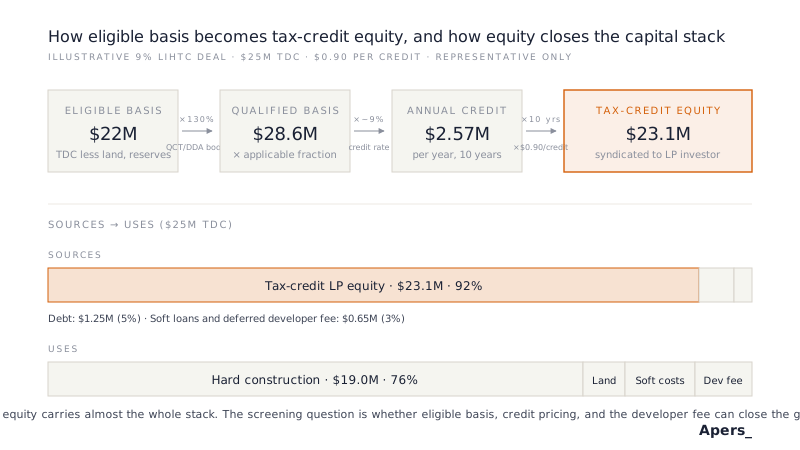
Eligible basis starts as total development cost less non-depreciable items: land, most reserves, and permanent financing costs. Projects located in a HUD-designated Qualified Census Tract or Difficult Development Area receive a thirty percent basis boost, which many state agencies also extend on a discretionary basis to competitively selected 9% deals. The boost is the single biggest lever on credit yield, and any screener that ignores it will systematically underprice deals in the metros where LIHTC gets built.
Qualified basis is eligible basis multiplied by the applicable fraction, which is the share of units or floor area restricted to eligible tenants. A 100-percent affordable deal has an applicable fraction of one; a mixed-income deal splits it. Annual credits equal qualified basis times the applicable credit rate. That rate has been fixed at nine percent and four percent floors by federal statute, so the rate variability that drove the pre-2015 model has been legislated away, but the arithmetic remains the same.
The tax-credit LP investor buys ten years of annual credits, discounted to present value at the price per credit dollar the syndication market clears. Pricing typically sits in an $0.85 to $0.95 range per credit dollar, with 9% credits pricing tighter than 4% credits and CRA-motivated bank investors pricing tighter than tax-motivated funds. Every penny of pricing moves the total equity raise by roughly one percent of the annual credit stream times ten years, which on a mid-size deal is real money.
The Sources-and-Uses Math
The screening verdict lives on the sources-and-uses page. Uses are total development cost, decomposed into hard construction, land, soft costs, financing, reserves, and the developer fee. Sources are the financing that pays for those uses: tax-credit equity from the chain above, permanent debt sized against restricted operating cash flow, seller notes, soft loans from housing trusts or HOME programs, and any deferred developer fee the sponsor is willing to leave on the balance sheet.
The permanent debt line is small compared to a market-rate deal, because restricted rents produce lower NOI, and agency lenders on affordable deals hold to conservative debt service coverage floors of 1.15 to 1.20. On a 9% deal the debt line often lands under ten percent of total development cost. On a 4% deal it lands higher, because the equity gap is larger, but never large enough to cover the gap on its own. Soft sources close what remains.
A screener that treats sources and uses as an afterthought misses the entire verdict. The question the sponsor is answering is not "does the deal produce a good IRR." It is "given the eligible basis I can generate, the credit pricing I can achieve, and the soft sources I can assemble, does the sources column reach the uses column, or does it come up short by two million dollars I do not have."
Developer Fee as the Return Mechanism
Market-rate developers earn on promote and residual sale value. LIHTC developers earn primarily on the developer fee, because the promote is small (the LP investor takes 99.99 percent of tax credits and losses during the compliance period) and the residual sale is deferred until Year 15 at the earliest.
The developer fee is typically ten to fifteen percent of total development cost, subject to state housing agency caps that vary by jurisdiction and by project size. On a $25 million deal that fee sits between $2.5 million and $3.75 million. A portion is paid at construction closing, a portion at conversion to permanent financing, and a portion is often required to be deferred and paid out of project cash flow over the compliance period. Deferred developer fee is itself a source in the capital stack: it is essentially a subordinate loan from the developer to the deal, which fills a gap without requiring an external soft source.
Screening the developer fee correctly means testing two things. First, whether the fee at the state agency's cap is enough to compensate the sponsor for the entrepreneurial risk and the multi-year development timeline. Second, whether the portion required to be deferred is small enough that the project cash flow, net of debt service and the reserves the agency requires, can actually pay it back inside the compliance window. Deals that require deferring more than half the fee and rely on aggressive cash flow assumptions to recover it are structurally fragile.
The 10-Year Credit, 15-Year Compliance Horizon
LIHTC has two horizons and they do not align. Tax credits deliver over ten years starting at the building's placed-in-service date. The compliance period runs fifteen years, extended by at least an additional fifteen through the extended-use agreement most states require. So the LP investor collects credits for ten years, watches the property operate under restriction for five more, and then can exercise a right of first refusal or a qualified contract to exit at Year 15 while the property remains restricted for another fifteen or longer.
That horizon mismatch has two screening implications. First, any modeling of Year 15 exit value is not a market-value exit. It is a preservation-buyer exit at a preservation cap rate, and often priced at the outstanding debt plus a small premium. A screener that pencils Year 15 at market residual is telling the developer a lie. Second, the LP investor's IRR is driven almost entirely by the ten-year credit stream, which means the syndication pricing on the front end has already monetized the LP's return. The developer's return is the fee and the operating cash flow, not the reversion.
How TX-101 Runs the Framework
TX-101 is the Apers open institutional-tier model that implements this framework. The credit-type toggle sits at the top of the sheet: 4% or 9%. Below it, an eligible-basis worksheet backs out non-depreciable costs from total development cost, applies the QCT/DDA boost where the deal qualifies, and computes annual credits at the fixed statutory rate. A syndication panel prices the ten-year credit stream at a per-credit-dollar input the reviewer can stress, and reports total tax-credit equity raised.
Sources and uses is the load-bearing output. Uses tie to the development budget, decomposed into hard, soft, land, reserves, and developer fee. Sources sum tax-credit equity, permanent debt sized off restricted-rent NOI at agency DSCR floors, soft sources entered as a line item per source, and deferred developer fee as the balancing plug. The verdict is visible on the sheet: either sources equal uses at a reasonable fee-deferral level, or the deal has a gap the sponsor has to fill or walk away from.
A ten-year operating pro forma runs alongside the sources and uses, projecting restricted rent under a HUD income-limit growth assumption, netting the compliance-heavy OpEx line, and confirming that project cash flow covers debt service plus the deferred developer fee repayment schedule. Sensitivity is run on the four variables that most often move the closing verdict: eligible-basis boost eligibility, credit pricing per dollar, permanent debt DSCR floor, and soft sources committed.
The model deliberately omits several things a full development budget would include. There is no monthly construction draw schedule, because at the screening stage the sponsor is testing whether the deal can close, not managing the construction phase. There is no Year 15 recapitalization modeling, because that decision is a separate exercise a decade after the underwrite. There is no per-tenant income certification or file-audit workflow, because compliance is an operating cost line, not a screening decision. Each omission traded scope for solvability at the go/no-go moment. When the deal graduates past screening, the sponsor moves to a full development model appropriate to the credit type and the project's construction complexity.
When TX-101 Stops Being Enough
TX-101 is a screening tool. Once a deal survives it and the sponsor commits to pursuing an allocation or a bond inducement, the reviewer moves to models that handle the full development workflow:
- Full ground-up development budget and draw schedule: DV-001 Ground-Up Development
- Existing restricted property acquisition (not new development): AQ-132 Multifamily Value-Add Affordable / Workforce
- Heavier repositioning of an existing multifamily asset with an affordability component: AQ-141 Multifamily Opportunistic Pro Forma
The handoff preserves the sources and uses, the eligible-basis calculation, and the compliance horizon. The full development model expands the construction-draw schedule, the multi-year interest reserve, and the phased placed-in-service dates that a screener holds constant.
Related Models
AQ-132 Multifamily Value-Add Affordable / Workforce is the acquisition sibling to TX-101. Same asset class and same regulatory regime, but AQ-132 underwrites existing restricted properties with covenants already in place, while TX-101 sizes new credit allocations on a development deal. They share vocabulary around AMI rent caps and compliance overhead but sit at opposite ends of the affordable-housing lifecycle.
DV-001 Ground-Up Development is the market-rate development sibling. Same construction complexity, same draw and interest-reserve mechanics, but built for a market-rate rent roll and a market exit rather than a tax-credit equity stack and a preservation horizon. When a deal is mixed-income with a market-rate component that carries its own equity economics, both models get used side by side.
AQ-141 Multifamily Opportunistic Pro Forma is the heavier-lift adjacent model for institutional multifamily. It covers repositioning strategies that can include an affordability carve-out or a covenant conversion, and it is the natural next step when a TX-101 screen surfaces a preservation acquisition rather than a new-construction development.