Why This Is Not Market-Rate Value-Add
Value-add on AMI-constrained multifamily, whether the asset is a LIHTC-encumbered building or a naturally-occurring affordable and workforce property, is a different underwrite from market-rate value-add on every input that matters. An analyst who runs a standard value-add pro forma on an income-restricted deal will overprice it. Rent lift is not bounded by comp; it is bounded by the HUD income limit for the tenant's AMI band. Annual rent growth is not a submarket assumption; it is a regulatory publication. Exit is not to a value-add fund shopping IRR; it is to a preservation buyer shopping mission and basis. Every one of those substitutions changes the math.
The screening problem is not detecting that a deal is affordable. The teaser will say so. The problem is that the strategy sits inside a different set of ceilings than the model in the analyst's muscle memory, and running the wrong model produces a verdict that is off by hundreds of basis points on yield-on-cost and off by full turns on IRR. The correct model has the ceilings built in and asks for the inputs those ceilings actually require.
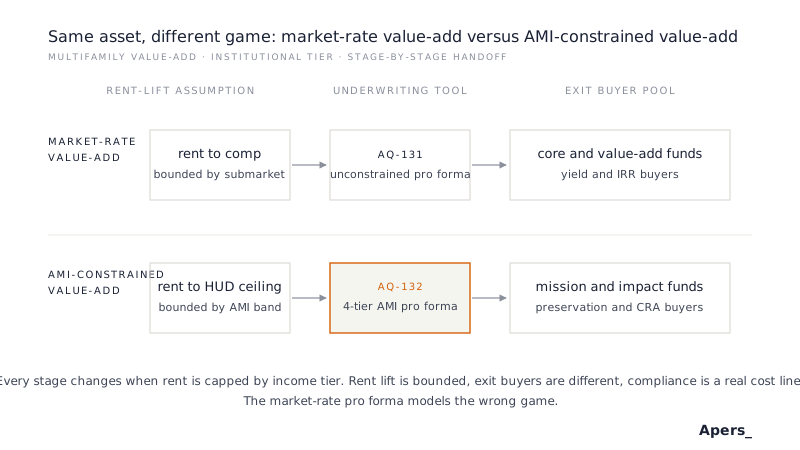
This article walks through the framework a proper AMI-constrained value-add underwrite implements, then shows how AQ-132, the Apers open institutional-tier model, runs that framework on the sheet.
The 4-Tier AMI Rent Stack
Affordable and workforce rent rolls are a stack, not a curve. Every restricted unit is assigned to an AMI band with a maximum rent published by HUD for the metro. Four bands cover almost every institutional deal: <30% AMI (deep affordable, usually voucher-supported), <50% AMI (very low income), <60% AMI (the LIHTC set-aside line), and <80% AMI (the workforce band that most naturally-occurring affordable housing lives in).
A model that treats the rent roll as a single blended average misses the entire point. The wedge between tiers is where value-add sits, and the wedge between the top tier and unrestricted market rent is what the exit buyer is really underwriting. The screener needs unit counts, current average rent, and HUD ceiling per tier in the deal's metro.
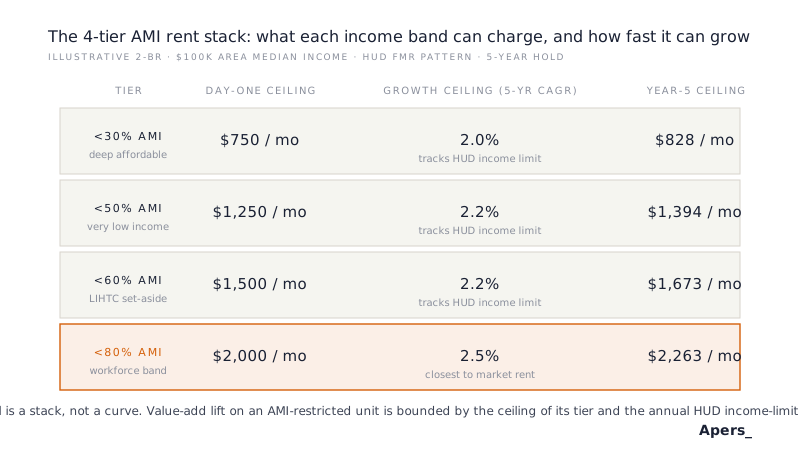
The workforce band is where most value-add lift happens. Renovation and turnover can move a naturally-occurring unit from a below-ceiling market rent to the <80% AMI ceiling, and the ceiling itself moves each year as HUD republishes income limits. Deep-affordable and LIHTC tiers rarely have wedge to close because they were already renting at their ceiling on day one.
Why Rent Growth Is Capped, Not Modeled
Market-rate multifamily assumes rent growth as a submarket forecast: three percent per year, plus or minus a stress case. On an AMI-restricted unit, rent growth is not a forecast. It is a ceiling published annually by HUD when it releases the next year's income limits for each metro. The ceiling typically moves two to three percent per year, sometimes flat, occasionally down.
A correct model does not ask for a rent growth assumption on the restricted units. It asks for a HUD income-limit growth assumption, then computes what the maximum allowable rent becomes each year, then caps the projected rent at whichever is lower: the market-rate assumption on unrestricted units or the HUD ceiling on restricted units. Getting this wrong looks like a slow-motion inflation of rent well past the tier ceiling by year five, producing a stabilized NOI that no compliance auditor would allow.
A second-order effect: if HUD income limits grow slower than expected during the hold, the model needs to catch the deceleration. The growth assumption should be a single input the reviewer can stress in the sensitivity table, not a hard-coded default buried in a formula.
Blended Income: Rent Roll Plus Vouchers
Affordable properties frequently carry income streams the market-rate pro forma has no line for. Tenant-based vouchers pay the difference between the tenant's 30% of income contribution and the Public Housing Authority payment standard, which can push effective revenue per unit above the deep-affordable ceiling. Project-based Section 8 contracts pay a HUD-negotiated rent that can exceed the AMI ceiling entirely and renew on a schedule that carries real duration risk. Both streams need to be modeled separately from base rent so the reviewer sees which portion of NOI depends on federal subsidy renewal.
A proper screener asks for three revenue lines per tier: tenant contribution, voucher subsidy per unit, and units with project-based contract coverage. The blended effective rent is the composite, but the underlying inputs stay visible. Voucher renewal risk shows up on a screener that stresses payment standards; contract-renewal risk shows up on a screener that has the Section 8 contract expiration year as a modeled variable.
The Compliance Line Item
Compliance on a LIHTC or HUD-assisted property is not a footnote. Annual tenant income re-certifications, unit-file audits, HUD REAC inspections, and the compliance-consultant retainer add roughly one hundred to three hundred dollars per unit per year on top of market-rate OpEx. On a two-hundred-unit property that is a fifty-thousand-dollar line the market-rate pro forma quietly drops on the floor.
The framework treats compliance as a first-class OpEx category. The screener asks for compliance overhead per unit as a separate input, escalates it independently of general OpEx growth (compliance costs tend to grow faster than payroll), and reports the all-in expense ratio with and without the compliance layer so the reviewer sees how much yield compression comes from restrictions versus operations.
Who Actually Buys the Exit
The exit buyer pool for AMI-restricted assets is smaller than for market-rate and priced on different benchmarks: basis per unit and affordability preservation, not IRR at target. Preservation buyers, mission-driven REITs, CDFIs, and tax-motivated impact funds will price tighter than a market-rate value-add fund, but they are also less willing to pay for aggressive rent-growth stories the seller cannot prove.
Practically, the exit cap assumption should be tested against preservation-buyer comps, not core multifamily comps. The model should also distinguish the theoretical unrestricted exit (what the property would sell for if covenants expired) from the actual restricted exit (what a preservation buyer will pay given the covenant runs another twenty years). The gap between the two is the affordability-preservation wedge, and it determines whether the seller optimizes for basis or for IRR.
How AQ-132 Runs the Framework
AQ-132 is the Apers open institutional-tier model that implements this framework. The rent roll is entered by AMI tier with unit counts, current tenant rents, and HUD ceilings for the metro. A voucher and project-based Section 8 panel captures subsidized revenue separately from base rent. A ten-year pro forma projects each tier's rent under a HUD income-limit growth assumption, caps the projection at each year's published ceiling, and rolls up blended NOI net of compliance overhead. Debt is sized against stress-case NOI under agency or CDFI parameters. Sensitivity is run on the three variables that move the answer: AMI-limit growth rate, voucher renewal probability, and compliance OpEx escalation.
The model deliberately excludes several things a LIHTC development model would include. No tax-credit equity pricing panel: AQ-132 is an acquisition tool for existing restricted properties, not a development tool. No Year 15 exit event modeling: acquisition-stage covenants typically have decades of remaining term. No per-credit yield calculation: the buyer is underwriting stabilized cash flow, not tax attributes on a construction deal. Each omission traded scope for solvability at the acquisition tier. When the deal is a development or a Year-15 recapitalization, the reviewer moves to a different model built for that vintage.
When AQ-132 Stops Being Enough
AQ-132 is a purpose-built value-add acquisition tool. It stops being the right sheet when the deal changes shape. Pick the model that matches the actual scope:
- New LIHTC development (4% or 9%): TX-101 LIHTC Screening Model
- Market-rate value-add on the same asset class: AQ-131 Multifamily Value-Add Pro Forma
- Quick screen before full underwrite: AQ-130 Multifamily Value-Add Pocket
- Opportunistic multifamily with heavier lift: AQ-141 Multifamily Opportunistic Pro Forma
Handoffs within the value-add family (to AQ-131 for a market-rate carve-out, or up to AQ-141 for a repositioning that changes the affordability mix) preserve the AMI rent stack and layer additional mechanics on top. A handoff to a development model is not a copy across, because the inputs are different in kind.
Related Models
AQ-131 Multifamily Value-Add Pro Forma is the market-rate sibling of AQ-132. Same asset class, same value-add strategy, same institutional tier. The structural difference is that AQ-131 has no AMI rent stack and no compliance line. When a deal has a market-rate carve-out inside a majority-affordable property, both models get used side by side.
AQ-130 Multifamily Value-Add Pocket is the pocket generalist for value-add multifamily. It is a market-rate screener. If the teaser signals an AMI-restricted deal, skip AQ-130 and go straight to AQ-132: the pocket's unconstrained rent-lift math will misprice the deal in either direction.
TX-101 LIHTC Screening Model is the adjacent tool for new LIHTC development. AQ-132 acquires existing restricted properties; TX-101 sizes new credit allocations and prices developer equity. They share vocabulary but live at opposite ends of the affordable-housing lifecycle.