The Value-Add Screening Problem
A value-add multifamily desk sees ten to twenty broker teasers a day. Most show a rent gap of some kind, because that is what puts a deal in front of a value-add buyer. The screening problem is not spotting the gap. It is figuring out which of the ten to twenty gaps is real, priced correctly, and financeable, before the full pro forma eats two days of an analyst's week.
The full value-add pro forma is a serious model: unit-level rent rolls, phased renovation draws, monthly cash flow, refinance timing, promote structure. It exists because the deals that survive screening deserve that level of care. It does not exist to answer the question the pocket answers: is this a value-add story that pencils on reasonable assumptions, or a rent-growth fantasy dressed in a broker teaser.
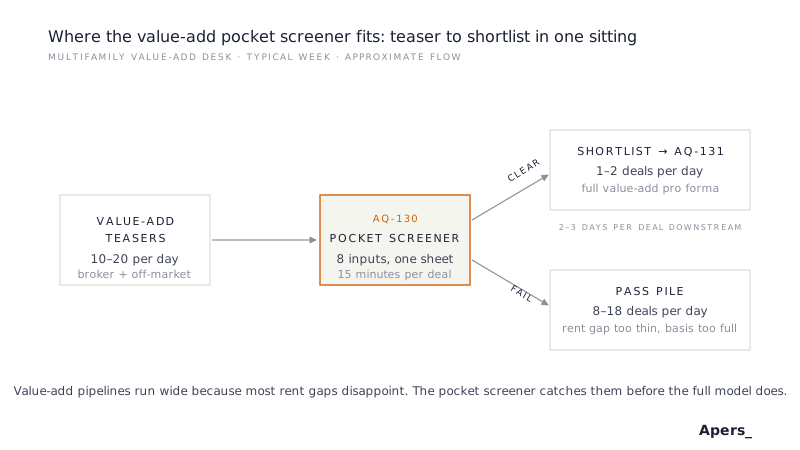
Done well, value-add screening is a fifteen-minute exercise per deal. Done badly, it is either a full underwrite dragged forward too early or a vibe check that mistakes headline rent lift for equity return. This article walks through the framework a proper value-add screener implements, then shows how AQ-130, the Apers open pocket model, runs it on a single spreadsheet page.
What the Value-Add Wedge Actually Is
Value-add is a value creation story with three legs. Move rents from an in-place average to a market average by renovating units. That expands NOI. Apply the same or a slightly softer exit cap to the higher NOI. That expands value. The delta between purchase value and stabilized value, net of the renovation budget, is the wedge. Everything the screener does is a check on whether that wedge is large enough to justify the risk of executing on the business plan.
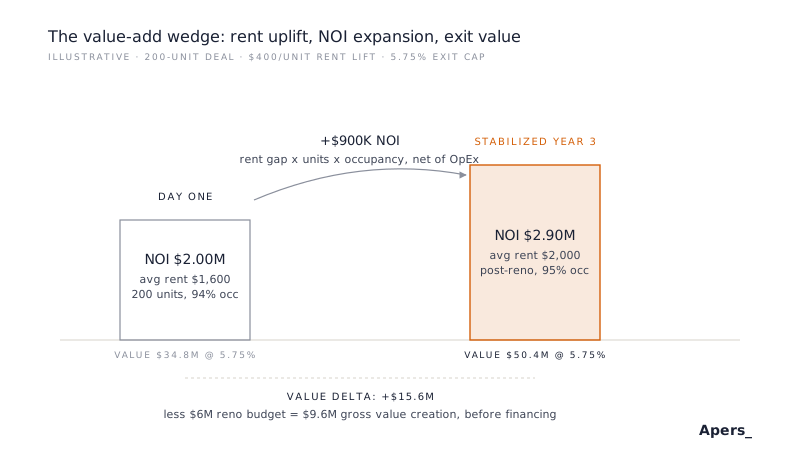
Two things matter for a screener. The NOI lift is the product of four numbers: rent gap per unit, unit count, occupancy at stabilization, and net-of-OpEx retention. A screener that only asks for rent gap ignores three of the four. And the wedge scales linearly with rent gap and inversely with exit cap, so small moves in either swing the value delta by millions. Sensitivity is not optional.
The Eight Inputs a Value-Add Teaser Should Supply
A properly scoped value-add screener asks for the inputs a legitimate teaser contains plus the minimum extras needed to price the rent lift. More than that reads like a full pro forma. Less than that cannot compute the wedge honestly. In practice, eight fields.
- Purchase price and unit count. Together they set the per-unit basis, the first sanity check against submarket comps.
- Current average rent per unit, from the rent roll or T-12. What the property produces before any renovation dollar is spent.
- Market rent per unit, from third-party comps or submarket survey. Where renovated units are expected to land, not where the broker hopes they land.
- Total renovation budget, as a single dollar figure. Per-unit detail is a full-pro-forma question.
- Operating expenses per unit, blended for the stabilized property. Taxes, insurance, and payroll dominate; the rest rolls in.
- Loan-to-value on acquisition debt. Sixty-five to seventy-five percent is standard; the actual quote matters more than the range.
- Interest rate on the acquisition loan. Broker quote if there is one, otherwise the desk's current default.
- Exit cap rate, typically going-in plus twenty-five to fifty basis points for a five-year value-add hold. A flat exit cap deserves a flag; a tighter one deserves a rejection.
A teaser that cannot supply these eight is either incomplete or is asking the reviewer to invent the interesting numbers. Both are useful signals. The screener should make it easy to reject on missing inputs rather than fabricate them.
The Five Metrics That Decide the Pass/No-Pass Call
Given the eight inputs, five output metrics carry the verdict on a value-add deal. A pocket screener that returns fewer is not doing the job. A pocket screener that returns more is quietly trying to be the full pro forma and failing at both.
- Going-in cap rate. Current NOI over purchase price. Value-add basis prices tighter than core because the buyer is paying for the wedge, but a going-in cap fifty basis points inside the desk's target is the wrong deal or the wrong strategy.
- Stabilized cap on cost. Stabilized NOI over purchase price plus renovation budget. This reveals whether the plan actually creates yield or recycles it. A stabilized yield-on-cost that only matches the going-in market cap is not a value-add deal.
- Levered five-year IRR. Projected return over the hold, net of debt. Value-add is priced on IRR because the wedge is realized at exit.
- Equity multiple. Total distributions over invested equity. The sanity check on IRR. Strong IRR with weak multiple almost always signals a short-hold trade that needs perfect exit conditions.
- Average cash-on-cash across the hold. Value-add current yield is thin during renovation and recovers post-stabilization. The hold-averaged number confirms whether the deal produces meaningful current income or is a pure appreciation play.
Alongside the five metrics, a proper screener raises flags for the structural disqualifiers: yield on cost that fails to clear the going-in market cap by fifty basis points, DSCR below the lender's floor, exit cap tighter than going-in, and rent gap requiring more than twenty percent above the top comp. Flags do not kill the deal; they force the reviewer to state the assumption before advancing.
The Two Variables That Kill Value-Add Deals
A single-point verdict on a value-add deal is a verdict on a specific market rent and a specific exit cap. Both are guesses. Market rent is a submarket survey with a confidence interval. Exit cap is a forecast five years forward on a rate curve nobody owns. The screener returns a verdict on the assumed pair; the reviewer is deciding on the range.
The discipline is a two-way table on exit cap and market rent. Exit cap tested twenty-five basis points on either side of the base case in twenty-five basis point steps. Market rent tested five percent on either side in two point five percent steps. Read the table diagonally: if IRR clears the target on the diagonal, the deal survives realistic stress. If it clears only in the friendly corner, it is a story deal. If it dies in the middle, it belongs in the pass pile.
Exit cap and market rent are the two variables because they are the two the reviewer is most exposed to at a five-year hold. Interest rate matters, but it locks at close. Renovation budget matters, but a fifteen percent overrun moves IRR by less than an equivalent move in either exit cap or market rent. The screener tests where the money is actually made and lost.
How AQ-130 Runs the Framework
AQ-130 is the Apers open pocket model that implements this framework on a single spreadsheet page. Eight inputs across the top, a five-year annual pro forma in the middle (rent growth, stabilized NOI, cash flow after debt service), a return-metrics box on the right, and a two-way sensitivity table in the bottom-right corner testing exit cap against market rent. Fifteen minutes for a reviewer who knows multifamily.
The model deliberately excludes several things a full value-add pro forma would include. No unit-by-unit rent roll: the wedge scales on blended averages at the screening tier. No phased renovation draw schedule: the total budget captures the equity requirement. No monthly cash flow: annual is enough for the return metrics. No distribution waterfall: promote structure depends on capital stack details a teaser does not specify. No supplemental or refinance debt: either one at the screening tier hides which return is coming from the plan and which from financing.
Each of those omissions traded scope for solvability at the fifteen-minute mark. Adding any would make AQ-130 a slower and less honest triage tool. When a deal graduates past screening, the reviewer moves to AQ-131 and each omitted mechanic is modeled properly.
When the Pocket Stops Being Enough
If a deal clears the screener and survives the sensitivity table, the next step is the full value-add pro forma. Inputs transfer directly. The full pro forma expands the assumptions the pocket held constant:
- Unit-level rent roll with classic-versus-renovated distinctions and burn-off timing.
- Monthly cash flow through renovation and lease-up.
- Phased renovation draws matched against the interior-touch schedule.
- Refinance or supplemental debt at stabilization, sized against the higher NOI.
- Distribution waterfall with promote hurdles, GP catch-up, and clawback if applicable.
See AQ-131 Multifamily Value-Add Pro Formafor the institutional-grade sibling. If the deal is closer to opportunistic (major recapitalization, ground-up component, or a repositioning that changes the unit mix), the step up is AQ-141 Multifamily Opportunistic Pro Forma.
Related Models
AQ-131 Multifamily Value-Add Pro Forma is the direct institutional sibling one tier up. AQ-130 tells the reviewer whether the wedge is worth pricing; AQ-131 prices it with unit-level detail and monthly cash flow. The models share input vocabulary so the handoff is a copy across, not a re-key.
AQ-110 Multifamily Core/Core-Plus Pocket is the adjacent-strategy pocket in the same asset class. Use AQ-110 when the deal is stabilized or lightly repositioned and the wedge is cap-rate compression rather than rent-lift execution. If a teaser is marketed as value-add but the rent gap is under ten percent, the right sheet is often AQ-110, not AQ-130.
AQ-001 Quick Acquisition Screener is the cross-asset generalist. When a pipeline mixes asset classes, AQ-001 is the first-line triage tool and AQ-130 is the second look for the multifamily value-add subset.