About This Model
TL;DR
- Value-add multifamily is defined by the renovation program. A pro forma that treats renovation as a single Year-1 line item mis-sizes the peak equity, understates the interest-only benefit, and produces a stabilized NOI number that arrives on paper before the units arrive in the field.
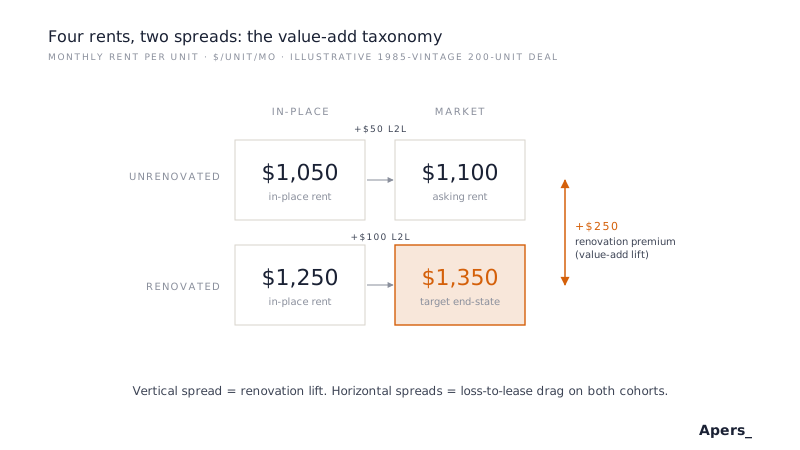
- AQ-131 tracks four distinct rent categories: in-place unrenovated, in-place renovated, market unrenovated, market renovated. The gap between in-place and market is the loss-to-lease; the gap between unrenovated and renovated is the renovation premium. Both drive different return levers.
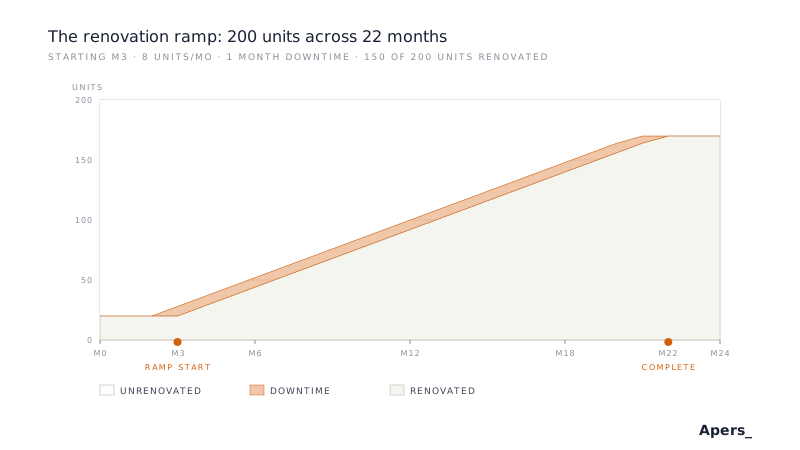
- Renovation runs at a user-set cadence (default 8 units per month) starting at Month 3, with one month of downtime per unit. For a 200-unit deal renovating 150, the program takes about 22 months to complete and interacts directly with the debt structure below.
- Vacancy is computed as two components rather than a single blended rate: 5 percent physical vacancy applied to GPR, plus the units currently in downtime priced at market rent. Blending them into one number understates the revenue drag during peak renovation months.
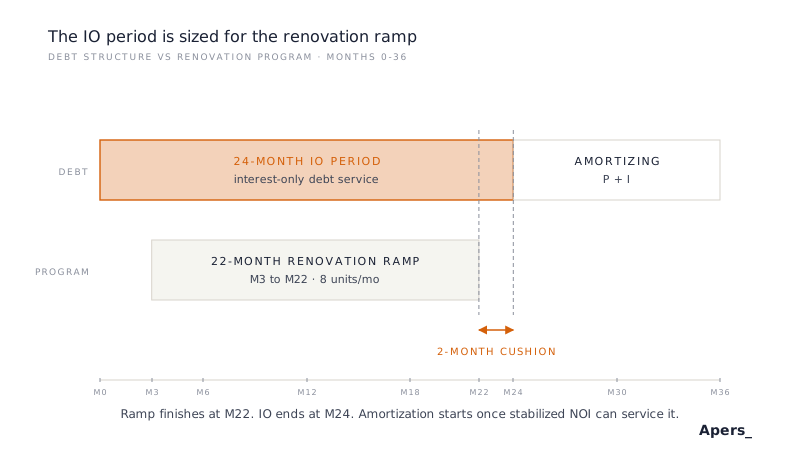
- The 24-month interest-only period on the perm debt is not decorative. It is sized to cover the renovation ramp, so debt service does not compete with the capex program for cash flow during the months when stabilized NOI has not yet arrived.
- Exit uses forward Year-11 NOI capitalized at the exit cap, with disposition costs. The pro forma runs 11 years so the 10-year hold's exit valuation has a real forward NOI to reference, not a phantom extrapolation.
- AQ-131 is a single-tranche, single-sponsor, single-sale model. No GP/LP waterfall, no tax modeling, no construction phasing, no per-unit lease abstracts. Each omission traded scope for a model that runs on a monthly grid without circular references.
Why Value-Add Underwriting Needs Explicit Renovation Phasing
The value-add multifamily deal is the underwriting where the "story" and the "spreadsheet" have to line up on the calendar, not just at exit. A stabilized-multifamily model can afford to treat Year 1 as roughly representative of the hold: NOI grows, debt amortizes, exit resolves the return. A value-add model cannot. Year 1 has 20 renovated units at $1,250 in-place rent, 180 unrenovated units at $1,050 in-place rent, and a $500K immediate capex hitting Month 1. Year 3 has 170 renovated units at $1,350 market rent, 30 unrenovated units at $1,100 market rent, and the renovation program fully absorbed. Between them is a two-year period where downtime, capex draws, and gradual rent lift move in opposite directions each month.
An acquisition model that treats the renovation as a single Year-1 capex line and applies a blended rent to all units in every period mis-sizes at least three things. It over-reports Year 1 NOI because it applies market rent to unrenovated units that are still leased at in-place. It understates peak equity because it collapses monthly capex draws into a single lump. And it hides the downtime drag entirely, because a unit in downtime is neither leased at in-place nor leased at market; it is producing zero revenue while carrying full operating expense.
AQ-131 was built to model the renovation program at the resolution the program actually operates: monthly, per-unit-cohort, with the debt structure and the operating pro forma responding to what the renovation crew did that month. Every design choice below reflects that resolution decision.
Design Choice: Dual Rent Roll (In-Place vs Market, Unrenovated vs Renovated)
AQ-131 tracks four rent categories per unit type per month. The taxonomy is not decorative; each number is doing work.
- In-place unrenovated ($1,050/unit/mo). What the existing lease-in-place actually collects on an untouched unit. This is the rent the model uses for the 180 unrenovated units leased on rollover to a new tenant.
- In-place renovated ($1,250/unit/mo). What the recently renovated units are actually collecting. Reflects the market premium the sponsor has captured but with lease concessions and stabilization discounts still in force.
- Market unrenovated ($1,100/unit/mo). What a new lease on an unrenovated unit would price at today, absent the below-market in-place lease. The gap of $50/unit/mo against in-place is the classic loss-to-lease.
- Market renovated ($1,350/unit/mo). What a new lease on a renovated unit prices at. The full asking rent. The gap of $100/unit/mo against in-place renovated is the loss-to-lease on the renovated cohort.
Two spreads matter for underwriting. The renovation premium is market renovated minus market unrenovated, or $250/unit/month. That is the value-add lift the renovation program is designed to capture. The loss-to-lease is market minus in-place, and it exists on both cohorts. A model that uses market rent as GPR from Day 1 (no loss-to-lease) will over-report early-year revenue by about $132,000 in Year 1 on this 200-unit deal, and will carry a permanent implicit loss-to-lease of about $18,000 per year on the 30 unrenovated units that stay unrenovated through the hold.
Design Choice: The 8-Units-a-Month Cadence with One Month Downtime
Renovation in AQ-131 is a phased program, not a lump sum. The user sets three parameters: total units to renovate (default 150 of 200), monthly renovation pace (default 8 units), and downtime per unit (default 1 month). At 8 units per month starting Month 3, the program takes about 22 months to complete. Each unit spends one month in downtime producing zero revenue while incurring full operating expense before returning as a renovated unit at the renovated in-place rent.
The cadence matters because it drives three of the model's most important outputs. First, monthly capex draws: at $15,000 per unit and 8 units per month, the program spends $120,000 in renovation capex every month from Month 3 to Month 22. That is a real, planned outflow that the debt structure has to accommodate. Second, downtime revenue drag: with 8 units in downtime at any given time during the program, the model loses about $10,800 per month in gross potential revenue at market rents. Over the 20-month ramp, that is roughly $216,000 of revenue that a single-lump-sum model would never see. Third, cohort progression: the model tracks how many units have been renovated by each month, which sets the mix used to compute GPR that month.
Faster cadences are supported by the input but rarely realistic. An 8-unit-per-month program is already aggressive for a 200-unit asset with in-place tenants; 12 or 15 units per month typically requires vacating tenants or restructuring leases and has legal and operational risk the model does not attempt to price. The default is set at the pace a competent property management team can actually execute.
Design Choice: Dual-Component Vacancy
Vacancy in AQ-131 is not a single blended percentage. It is two separate components that add together.
The first component is physical vacancy: 5 percent of GPR, applied every month as the ambient turnover, delinquency, and small operational gaps that exist even on a stabilized deal. The second component is downtime vacancy: the units currently in renovation downtime, priced at market rent (not in-place), applied as a full revenue haircut in the month the unit is offline.
Blending the two into a single "effective vacancy" number would understate the drag during peak renovation months. At the peak of the renovation ramp, roughly 8 units are in downtime at any given time. Priced at the renovated market rent of $1,350/mo, that is $10,800 of monthly revenue lost to downtime alone, on top of the physical 5 percent. Rolling those together would produce an effective vacancy of about 9 percent during the peak, dropping to 5 percent post-ramp; a static blended assumption would either overstate the drag post-stabilization or understate it during the ramp.
The dual-component structure also matters for the sensitivity tables. A stress on physical vacancy tests the operational assumption; a stress on downtime tests the renovation execution. Different risks, different mitigants; blending them makes both invisible.
Design Choice: The IO Period Sized for the Renovation Ramp
The permanent loan on this deal is a 30-year amortizing balloon with a 24-month interest-only period at the start. The 24-month IO is not a generic underwriting feature. It is a specific design decision tied to the renovation program.
During the renovation ramp, stabilized NOI has not yet arrived. Year 1 NOI is depressed by downtime, by lower in-place rents on the still-unrenovated majority, and by immediate capex. If the loan were amortizing from Month 1, monthly debt service would be higher than the deal can cover from operations during the ramp, and the sponsor would have to fund debt service from equity (or from a reserve line, which the model does not include). The 24-month IO absorbs the ramp: during IO, monthly debt service is interest only, which is meaningfully lower than a fully amortizing payment on the same loan.
By Month 25, the renovation program is roughly complete, the majority of units are at renovated market rents (subject to lease-up cadence), and the deal is producing stabilized NOI capable of servicing an amortizing payment. The step-up from IO to amortization at Month 25 is captured directly in the debt schedule; the model does not smooth or approximate the transition.
The general rule this encodes: the IO period should cover the renovation ramp plus a lease-up cushion. A 24-month program with a 12-month lease-up cushion fits inside a 24-month IO if the program starts at Month 0; here it starts at Month 3 and completes at Month 22, so the 24-month IO covers the program plus a two-month cushion. If the program pace or unit count changed, the IO period should be re-sized. AQ-131 exposes both as user inputs so the underwriter can adjust.
Design Choice: Forward NOI as the Exit Valuation Base
A buyer at Year 10 is not paying for Year 10 NOI. A buyer is paying for the year of NOI they will collect on their first year of ownership, which is Year 11. AQ-131 codifies that convention: exit gross sale price equals Year 11 NOI divided by the exit cap rate.
The mechanical implication is that a 10-year hold requires 11 years of pro forma. AQ-131 runs Year 1 through Year 11, and only the Year 10 sale event uses Year 11 as its valuation base. A pro forma that stops at Year 10 has to either extrapolate a phantom terminal year or use Year 10 NOI as the exit base. Extrapolation introduces a valuation error; using Year 10 as the exit base understates the sale price by one year of rent growth, or about 3 percent on a growing NOI, which is about $130,000-$150,000 of sale proceeds on this deal.
Disposition costs are 2 percent of gross sale price (broker fees, transfer taxes, closing costs). Net sale proceeds are gross minus disposition costs minus loan payoff. Loan payoff at Year 10 is the amortized balance at Month 120, computed from the debt schedule, not the original loan face amount. The distinction matters: after 24 months of IO and 96 months of amortization, the balloon balance on the $18.48M starting loan is about $16.05M, meaningfully less than face.
What We Deliberately Left Out
AQ-131 makes explicit scope decisions to keep the model solvable on a monthly grid without circular references. Deals outside those boundaries belong in a different model.
- No GP/LP equity waterfall. AQ-131 returns single-sponsor levered IRR, equity multiple, cash-on-cash. Promote and hurdle structures belong in a dedicated waterfall model likeCS-001, layered on top of the base pro forma cash flows.
- No tax modeling or after-tax returns. Depreciation is a material driver of after-tax IRR for a taxable sponsor. AQ-131 returns pre-tax metrics only. Tax modeling requires jurisdiction, sponsor tax basis, and holding-entity structure that vary too much to hard-code.
- No construction phasing. All 150 units to renovate follow the same cadence starting Month 3. Multi-phase programs (renovate 50 units, hold, renovate another 50 based on leasing results) require different cash-flow logic and are out of scope for the base pro forma.
- No per-unit lease abstracts. The model tracks two rent cohorts (unrenovated and renovated) and blends within each. Per-unit lease terms, individual lease-end dates, and tenant-specific concession packages belong in a rent-roll modeling tool and are out of scope for an acquisition pro forma.
- No opportunistic or heavy-lift mechanics. If the deal requires bridge-to-perm financing, a scenario engine, or S-curve absorption, the correct model isAQ-141 Multifamily Opportunistic Pro Forma. AQ-131 targets deals where perm debt is available at close and the value creation lives in the renovation program, not in a distressed reposition.
- Single exit at end of hold. No partial sales, no recaps, no supplemental financings, no hold-extension scenarios. A refi mid-hold to return capital is a separate exercise that the base pro forma does not attempt to price.
How to Use the Model
AQ-131 targets IC-ready value-add multifamily underwriting: investment committee memos, JV/LP fundraising packs, sponsor pencil checks, lender DSCR stress tests. The workflow is four steps.
Step 1: Set the acquisition. Purchase price, units, price per unit, closing costs, and the split between units currently renovated and units to renovate. These feed sources and uses and the renovation budget.
Step 2: Set the rent taxonomy. In-place and market rents for both unrenovated and renovated units. Read the four numbers as a matrix (unit condition × lease basis) and check that both spreads (the $250 renovation premium and the $50-$100 loss-to-lease) look right for the submarket.
Step 3: Set the renovation program. Cadence (units per month), start month, downtime per unit, cost per unit. Verify the resulting completion month (units-to-renovate divided by cadence, plus start month) sits within the IO period on the debt.
Step 4: Size the debt. LTC, interest rate, IO months, amortization, term, exit cap. Confirm the IO period covers the ramp plus cushion and confirm the exit cap makes sense against the going-in cap and current market spreads.
Then read the returns and stress the sensitivity tables. A deal that clears the return target only at the friendly-corner assumption pair (highest reno lift, tightest exit cap) is a story deal that survives only under optimistic underwriting. Underwrite to the diagonal of the sensitivity, not to the point estimate.
Related
AQ-130 Multifamily Value-Add Pocket is the single-sheet pocket-tier version of the same underwriting. Use it upstream of AQ-131 for pipeline triage; graduate to AQ-131 when the deal earns a full IC-quality look.AQ-132 Multifamily Value-Add Affordable/Workforce Variant is the AMI-constrained sibling: same base architecture, but with rent caps at each AMI tier and compliance-cost overlays.AQ-141 Multifamily Opportunistic Pro Forma is the next tier of complexity: bridge-to-perm financing, scenario engine, S-curve absorption, waterfall. Use it when the deal is distressed or heavy-lift enough that AQ-131's single-tranche perm-at-close structure does not fit.AQ-111 Multifamily Core Pro Forma is the stabilized sibling with no renovation program at all: use it when the deal is a straight stabilized acquisition and AQ-131's renovation mechanics are not needed.