The Rollover Problem
Triaging an office building for lease rollover risk is the acquisition where the standard cross-asset screener stops earning its keep. A broker sends over eight suburban office buildings. Each one has a rent roll. Each rent roll has fifteen to sixty tenants, with lease expirations scattered across the next ten years and TI and LC packages that vary by tenant and market. Underwriting each building lease-by-lease is a day of work, minimum. Doing that for all eight before you decide which two to spend real time on is most of a week.
Office is the asset class where rollover is the dominant risk. Rent, cap rate, and debt terms all matter, but a suburban office building with 40% of its square footage rolling in year three is a completely different animal from one with 8% rolling per year. Any office screener that ignores rollover is answering the wrong question. Any office screener that models rollover lease-by-lease has stopped being a screener.
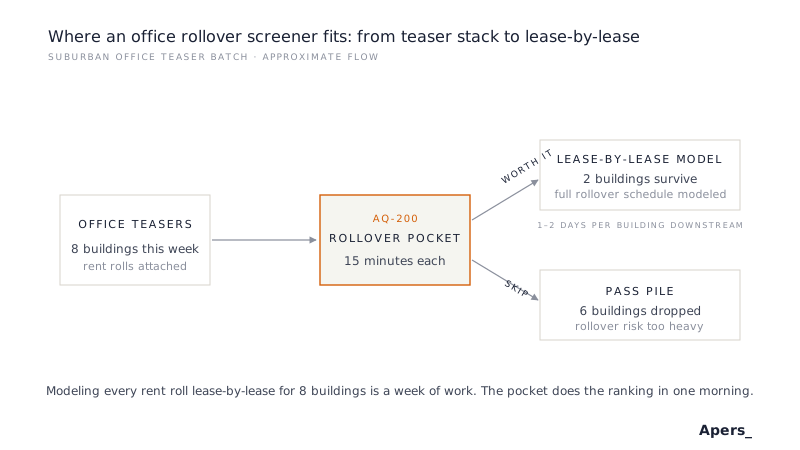
This article walks through the framework a rollover-aware office screener has to implement, then shows how AQ-200, the Apers open office rollover pocket model, runs that framework on a single sheet.
Why Office Screening Is Different From Multifamily Screening
A multifamily screener can treat the rent roll as a single blended in-place rent because unit turnover happens on a rolling basis, twelve-month leases dominate, and the tenant mix is homogeneous enough that an average is meaningful. The screener in that world is asking about price, cap rate, and rent growth.
Office does not work that way. Leases run three to ten years. A single anchor tenant can occupy 30% of the building. TI packages on a new lease can run twenty to eighty dollars per square foot depending on the tenant, the market, and the build-out condition. Leasing commissions are their own line. The rent roll is not a distribution around a mean; it is a schedule of dated cliffs. When any of those cliffs falls in the hold period, the return calculation depends on which specific tenants roll, at what rent, with what downtime, and at what TI cost.
A rollover-aware office screener has to acknowledge all of this without becoming a lease-by-lease model. That is the design problem the pocket exists to solve.
The Blended-Annual Abstraction
The screener's central move is to collapse the rent roll into two numbers: an average annual rollover percentage of total square footage, and a blended TI-plus-LC cost per rolled square foot. If a building has 200,000 SF and the reviewer estimates that roughly 20,000 SF rolls each year on average, that is a 10% annual rollover assumption. If new leases in the submarket typically require thirty-five dollars per SF of TI and three dollars per SF per year of LC amortized over the term, that becomes a blended turnover cost per rolled SF.
Both numbers are wrong for any specific tenant in any specific year. Both numbers are approximately right for the average of the rent roll over a five-year hold. That approximation is what makes fifteen-minute triage possible.
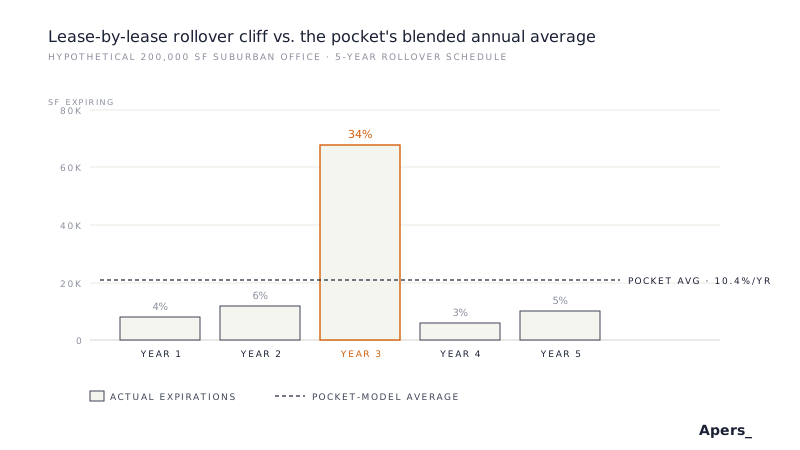
The abstraction is honest about its limits. A building with a smooth 10% annual roll is fundamentally different from a building with 4%, 6%, 34%, 3%, and 5%, even though both average 10.4%. The pocket model will not distinguish between them on the primary output. What it will do is get the reviewer to the right shortlist, then hand off the survivors to a lease-by-lease model that reads the actual schedule.
The Ten Inputs a Rollover-Aware Screener Needs
A properly scoped office pocket asks for ten fields. Fewer and the rollover math is missing a load-bearing piece. More and the pocket has crept into full underwriting territory.
- Purchase price and total leasable square footage. The denominator for every per-SF metric.
- Current occupancy percentage. Distinguishes an 88% leased building from a 65% leased building. Both are common in suburban office and they price differently.
- Average in-place rent PSF. The starting point for the rent roll roll-up.
- Annual rollover percentage. The central assumption of the model, computed by dividing SF expiring over the hold by the hold length in years.
- Market rent PSF. Where the rolled square footage re-leases to. If market is above in-place, rollover is upside. If below, it is a drag.
- TI and LC blended cost per rolled SF. The one-time capital hit each time a lease turns.
- Operating expenses PSF. Full-service or NNN treatment lives here.
- Debt terms. LTV and interest rate at minimum, amortization if the schedule matters.
The rollover percentage input is where the reviewer's judgment enters the model. Getting it wrong by two hundred basis points does not break the triage. Getting it wrong by a thousand basis points does.
TI/LC Cost vs. Market Rent Sensitivity
An office return is dominated by two variables the reviewer cannot know at triage: what re-leasing will actually cost, and where market rent will actually be when the leases roll. Every other assumption on the sheet moves the answer by less. So the pocket runs a 2x2 sensitivity on exactly those two variables and shows the return across four scenarios.
Read the 2x2 by comparing opposing corners. If the deal clears the target return in the friendly corner (low TI, high market rent) but breaks in the harsh corner (high TI, flat market rent), it is a story deal. If it clears both corners, it survives realistic rollover stress. If it clears neither, it dies at triage. Anything more granular than a 2x2 is false precision on an office pocket, because the underlying assumption is already a blended average.
How AQ-200 Runs the Framework
AQ-200 is the Apers open office rollover pocket. A single sheet with the ten inputs across the top, a five-year annual projection that applies the blended rollover percentage as a rent roll-up and the blended TI and LC as a one-time capital hit each year, a return metrics block on the right, and a 2x2 sensitivity in the bottom-right on TI cost versus market rent.
The model deliberately excludes several things a full office underwrite would include. There is no tenant-by-tenant rent roll, because the whole point of the pocket is to avoid keying one in. There is no downtime or free-rent modeling per rolled lease, because at the pocket tier downtime is folded into the blended TI/LC cost as an effective concession. There is no full-service versus NNN gross-up logic per tenant, because a single OpEx-PSF input carries the load. There is no anchor-tenant scenario isolation, because if a single tenant is 30% of the building, the pocket is the wrong tool anyway.
Each of those omissions is a design decision. A pocket that folded any of them in would be slower per building and would not change the triage output on the majority of deals. When the survivors graduate, they graduate to a model that expects a rent roll and treats the omitted mechanics properly.
When the Pocket Stops Being Enough
Two conditions trigger graduation from AQ-200 to a full office underwrite. First, the deal survives the 2x2 sensitivity and earns real diligence, meaning you are pricing an offer rather than ranking a stack. Second, the rent roll has a shape the blended average obscures: a single anchor tenant above 20% of the building, a rollover cliff in a specific year, a large expiring block at below-market rent, or heterogeneous full-service and NNN tenants that break the single OpEx assumption.
- Full-service office with lease-by-lease modeling: AQ-201 Office Full-Service Lease Rollover
- Stabilized office core acquisitions: AQ-211 Office Core Pro Forma
- Redevelopment or repositioning of an office asset: DV-002 Redevelopment / Adaptive Reuse
The handoff preserves every input from the pocket. Purchase price, SF, occupancy, in-place rent, market rent, OpEx, and debt terms all transfer directly. The full model then replaces the blended rollover assumption with the actual rent roll and replaces the blended TI/LC with per-tenant renewal economics.
Related Models
AQ-201 Office Full-Service Lease Rollover is the institutional-grade companion. Same asset class, same rollover-first framing, but with a full rent roll input area, per-tenant TI and LC assumptions, downtime and free-rent handling, and a proper lease-expiration schedule that drives the annual cash flow. Use AQ-201 when the deal has cleared triage and you are producing numbers for a committee.
AQ-211 Office Core Pro Forma is the adjacent-strategy full model. When the deal in front of you is a stabilized office asset with credit tenants and long weighted average lease terms, rollover risk is a smaller share of the return and the core pro forma's fuller treatment of debt structuring and exit assumptions matters more.
AQ-001 Quick Acquisition Screener is the cross-asset parent. AQ-200 is what happens when you take AQ-001 and specialize its assumptions for the one asset class where a single rollover input carries most of the pricing signal.